On this page:
The status of the state’s water resources across various categories, including storage levels, rainfall and seasonal outlooks.
Water storage levels
Metro Melbourne water storage levels
Northern Victoria water storage levels
* Victoria has a 50% share of inflows to Dartmouth and in Hume
Southern Victoria water storage levels
* Werribee Basin storage value is the combined volume of the Melton, Merrimu and Pykes reservoirs
Monthly storage levels
As at the end of May 2025, total combined storage levels for regional, Melbourne and statewide storage networks were as follows:
- Regional: 57% full (3% higher than the previous month).
- Melbourne: 73% full (3% lower than the previous month).
- Statewide: 59% full (2% higher than the previous month).
Download the monthly dataset
Updated 15 June 2024. The next update is in mid-July 2025.
Regional, Melbourne and all Victoria monthly storage levels

- Regional monthly storage levels - end January 2010 to end May 2025

- Melbourne monthly storage levels - end January 2010 to end May 2025

- Total Victorian monthly storage levels - end January 2010 to end May 2025

Regional monthly storage levels - end January 2010 to end May 2025
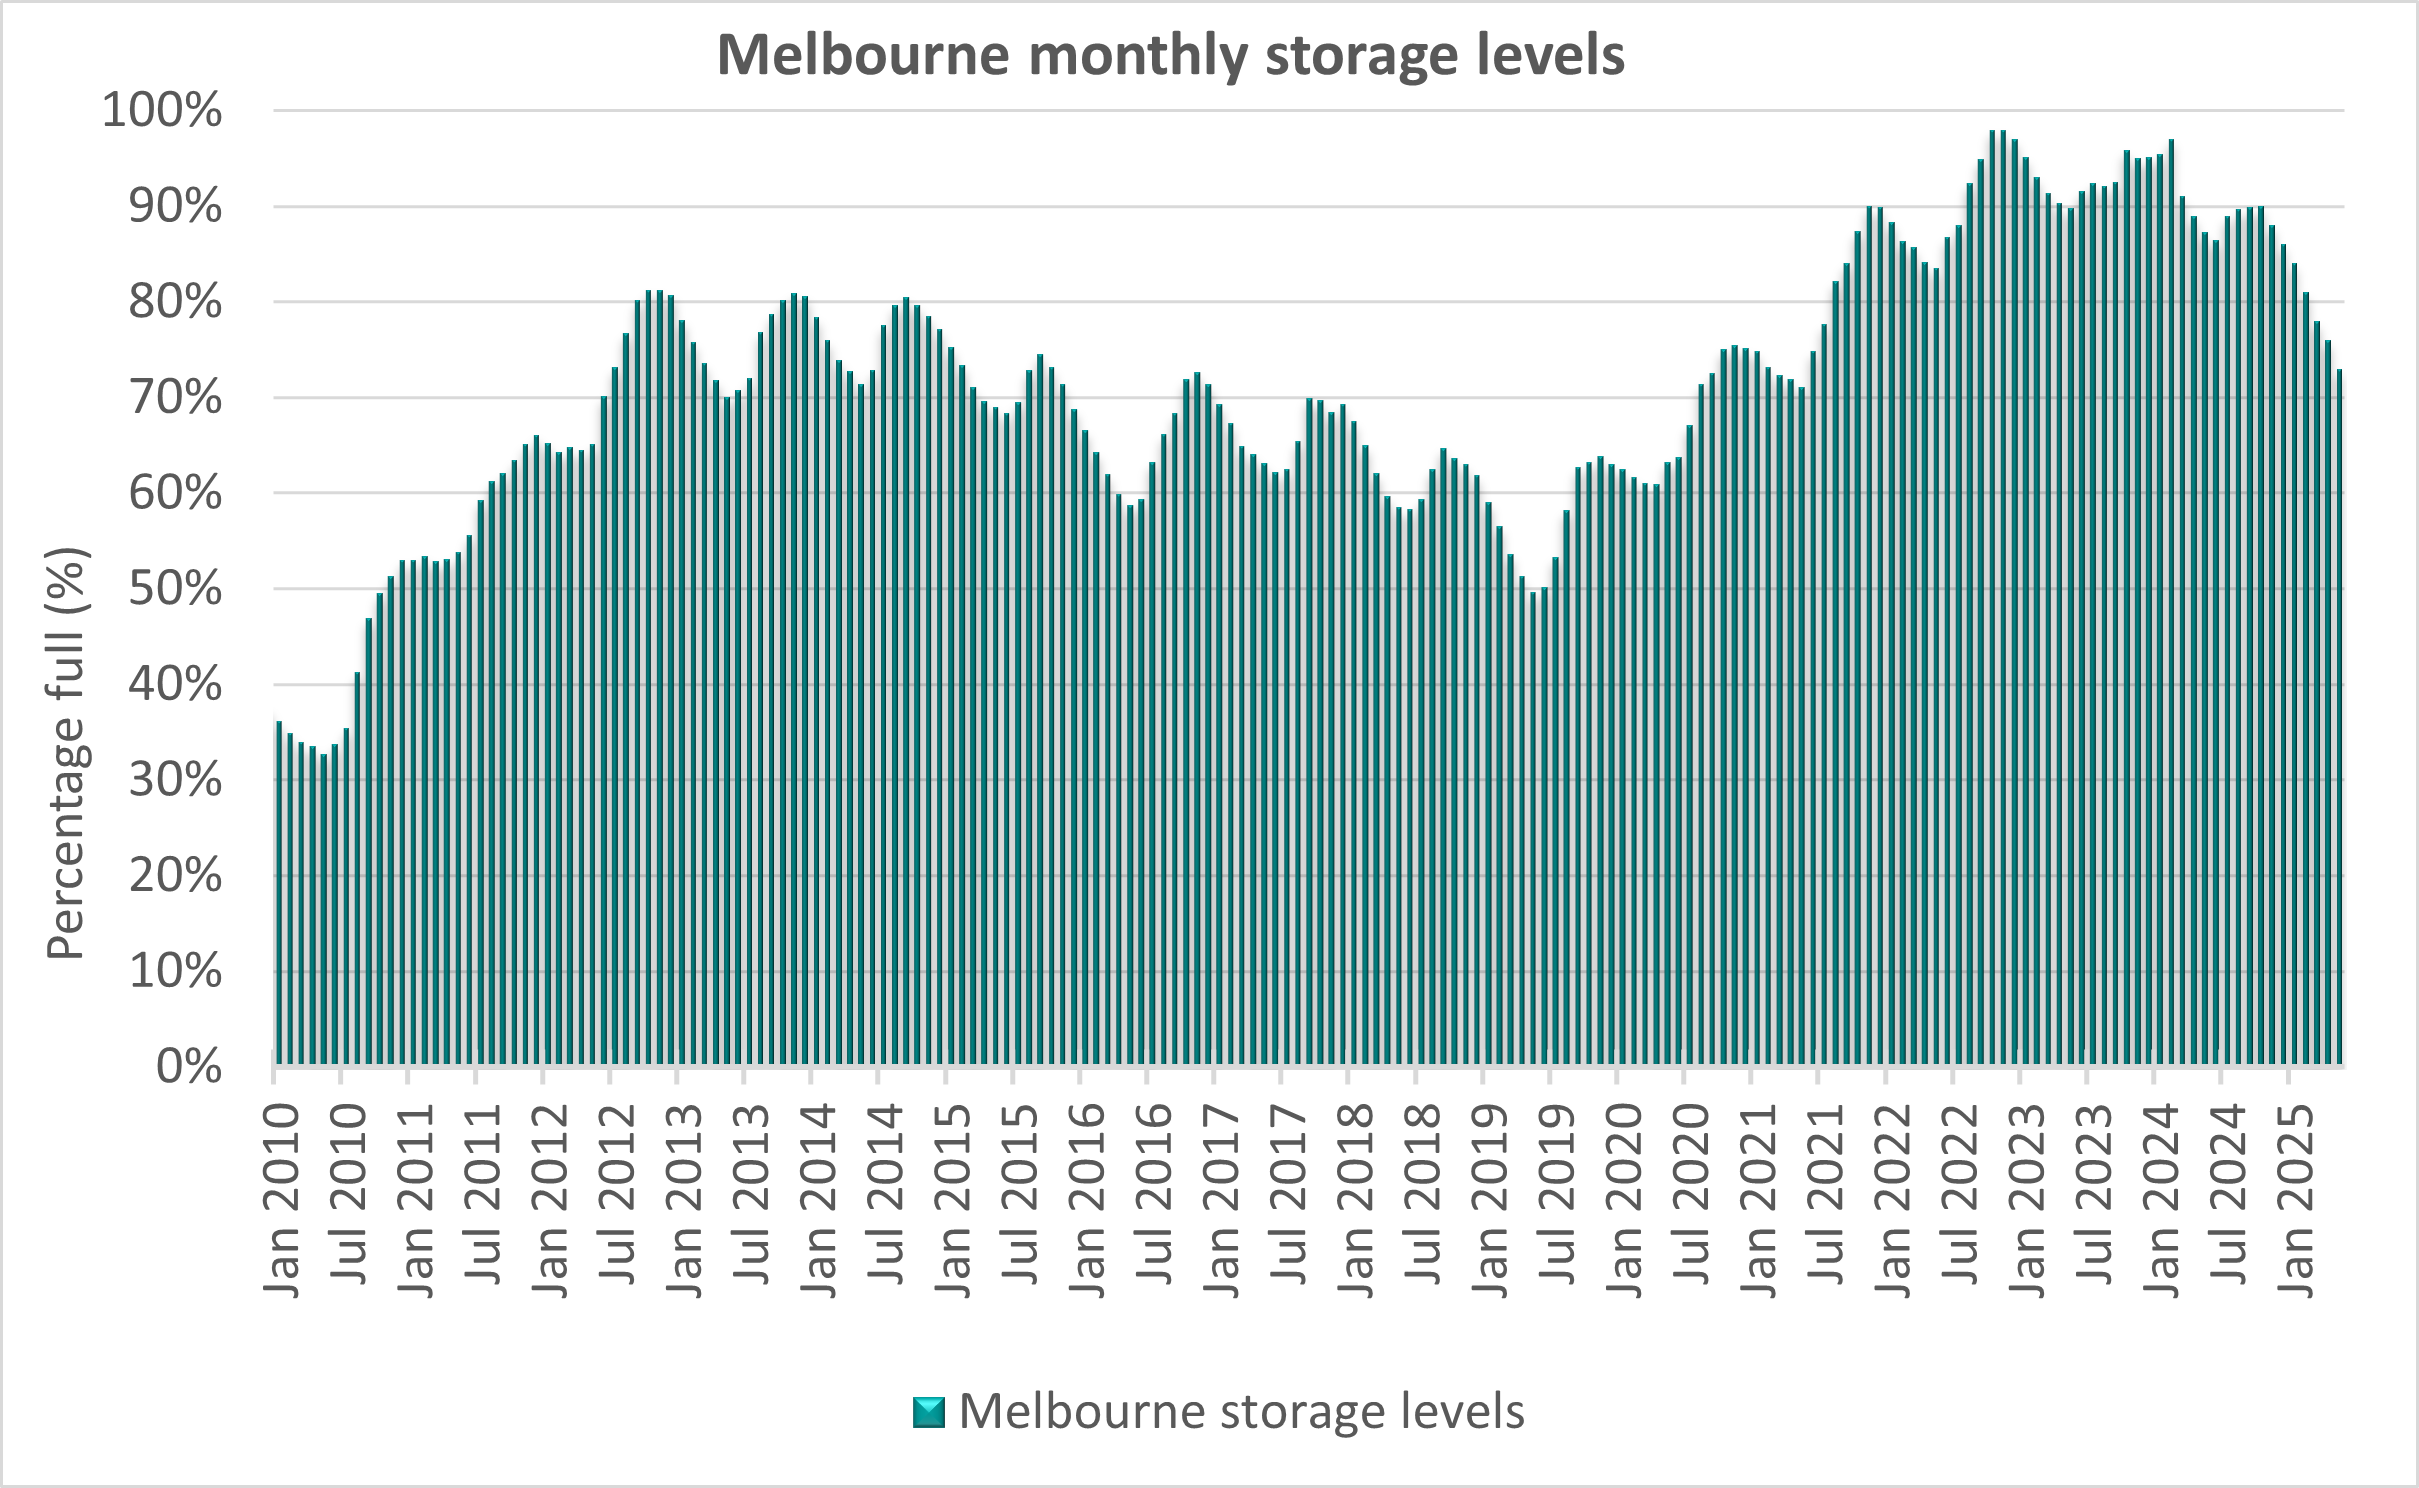
Melbourne monthly storage levels - end January 2010 to end May 2025
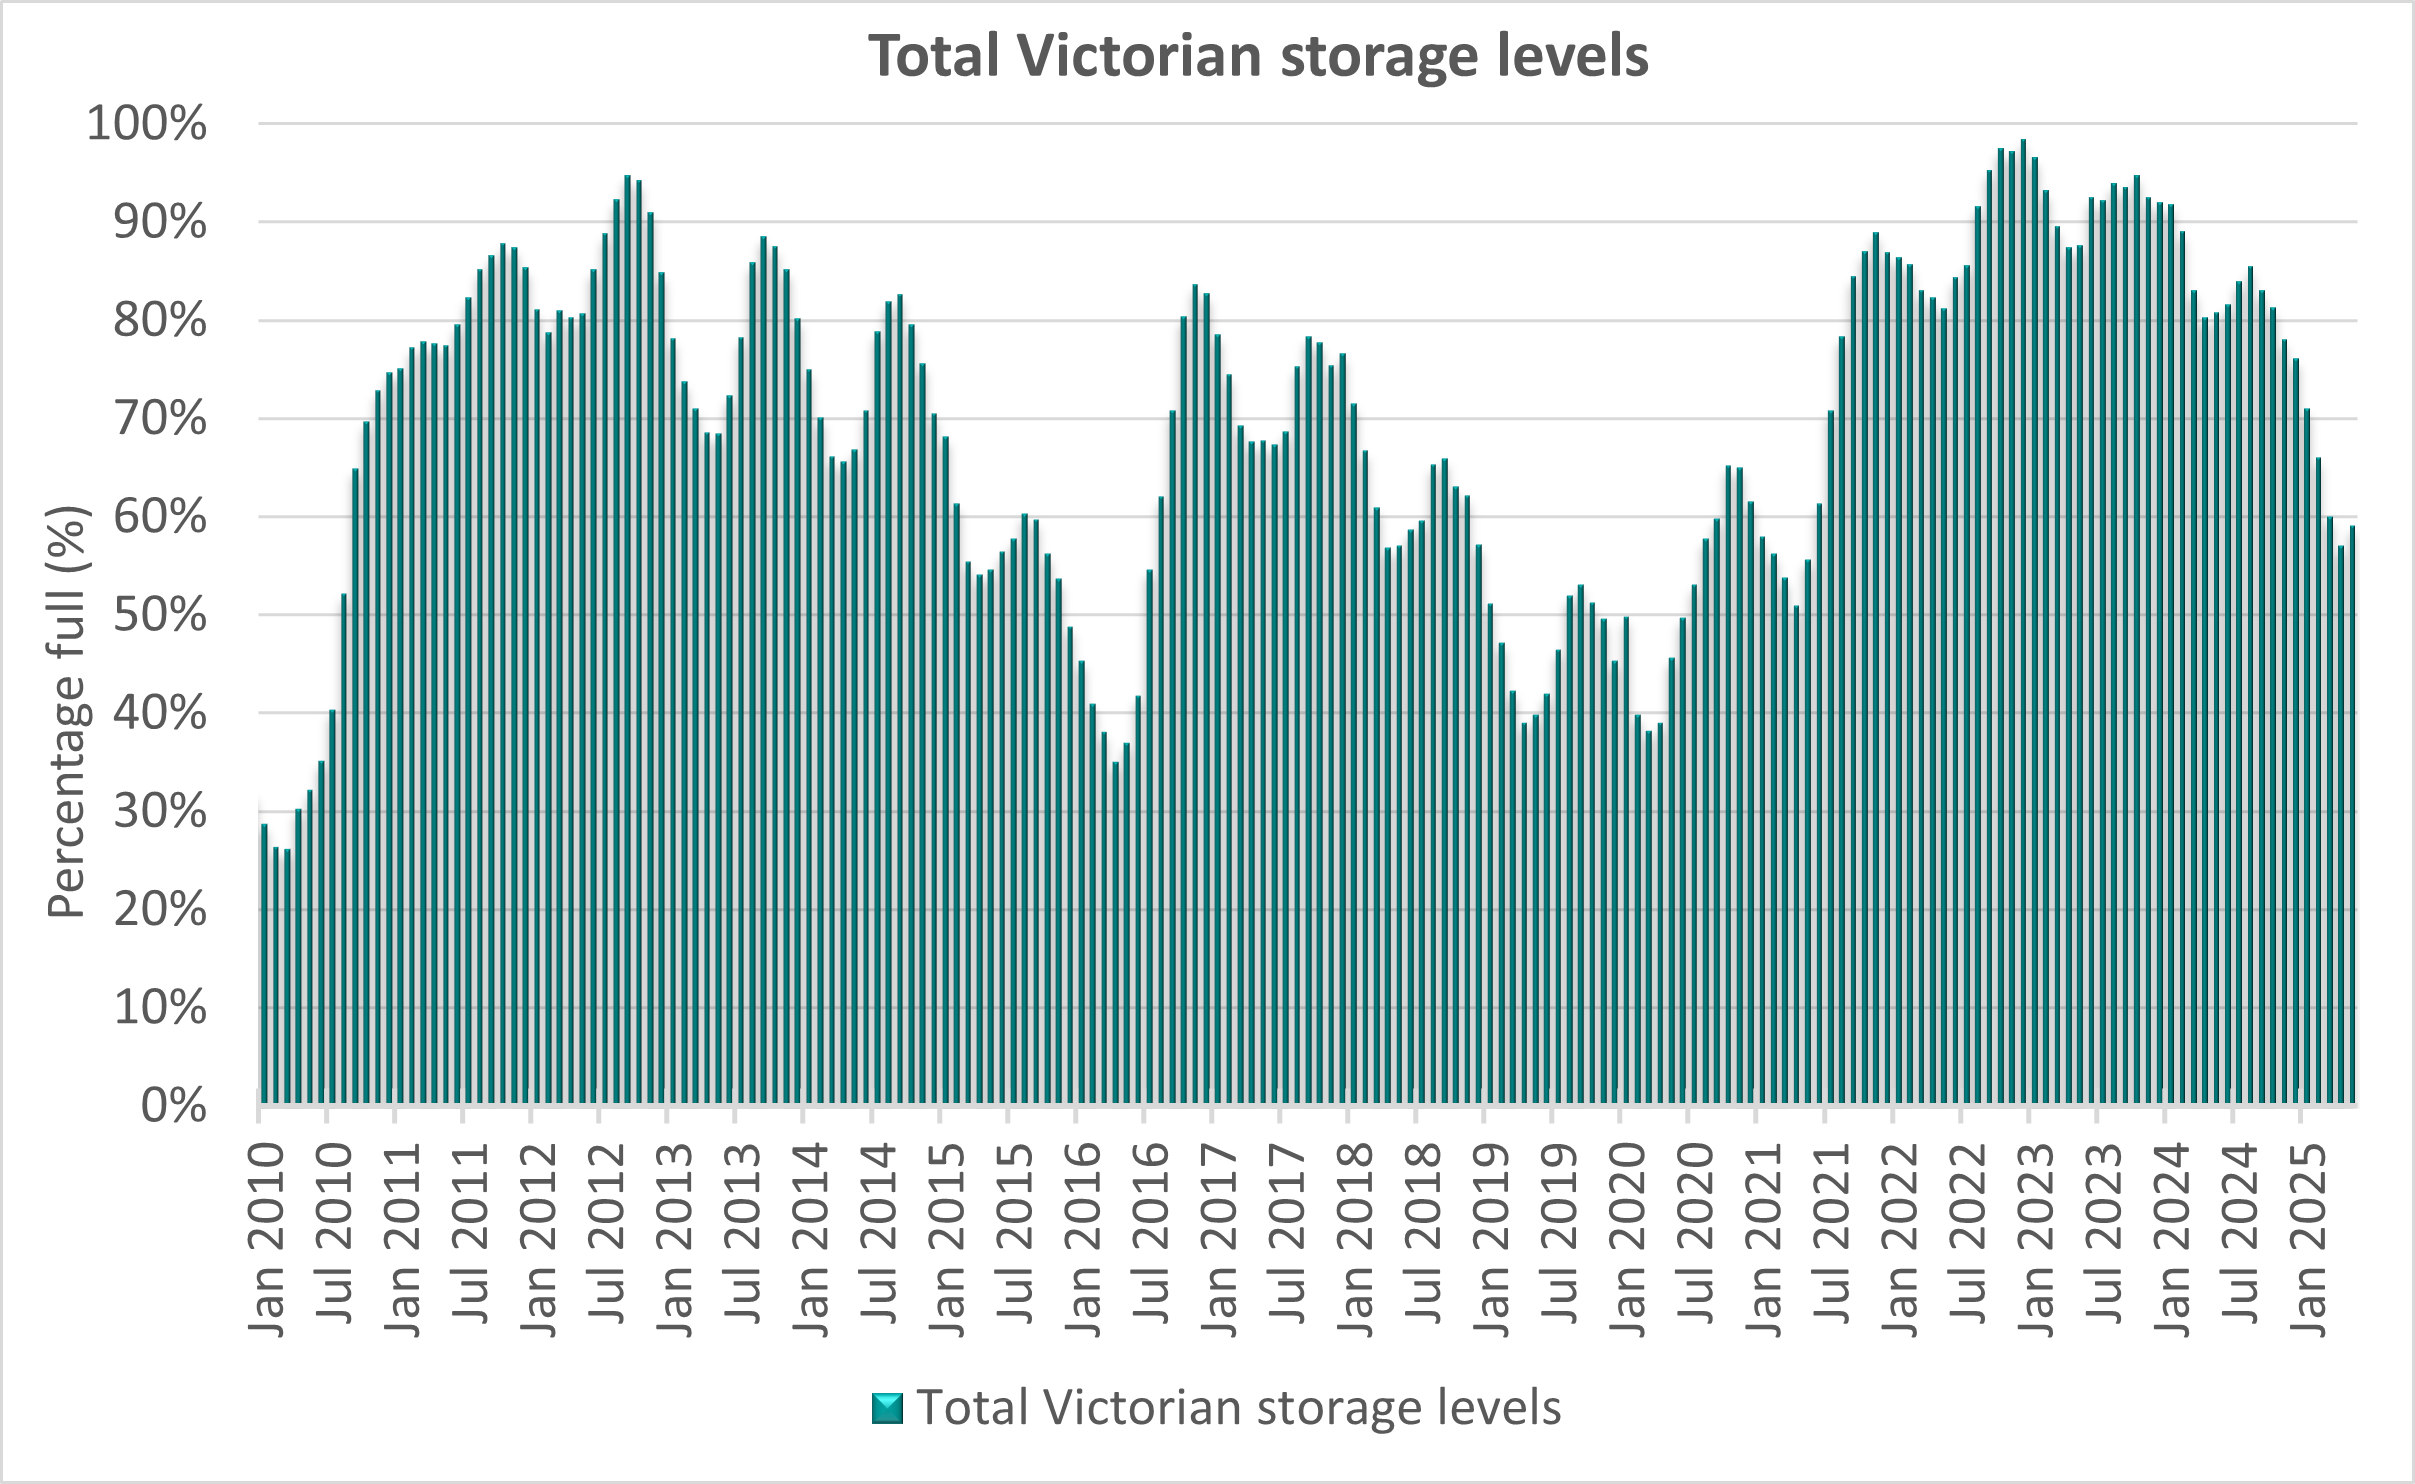
Total Victorian monthly storage levels - end January 2010 to end May 2025
Bureau of Meteorology rainfall maps
On the Bureau of Meteorology websites, view
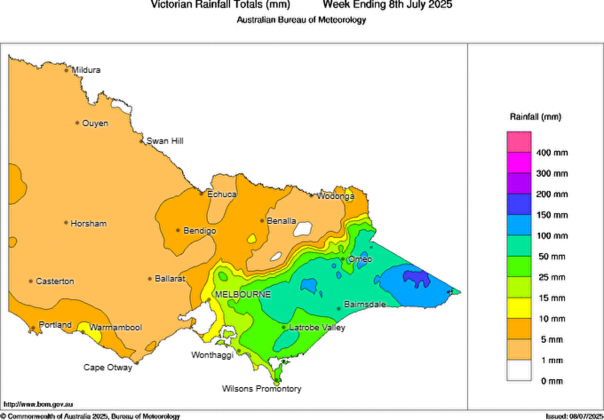
- Map of rainfall received in the week ending 8 July 2025
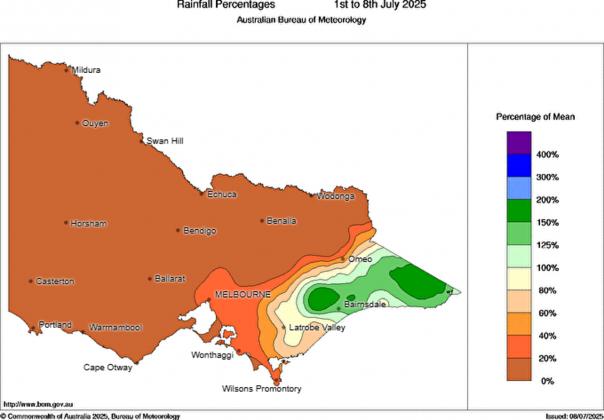
- Map of total rainfall received 1 to 8 July 2025

Map of rainfall received in the week ending 8 July 2025

Map of total rainfall received 1 to 8 July 2025
Seasonal climate outlook
Bureau of Meteorology climate outlook
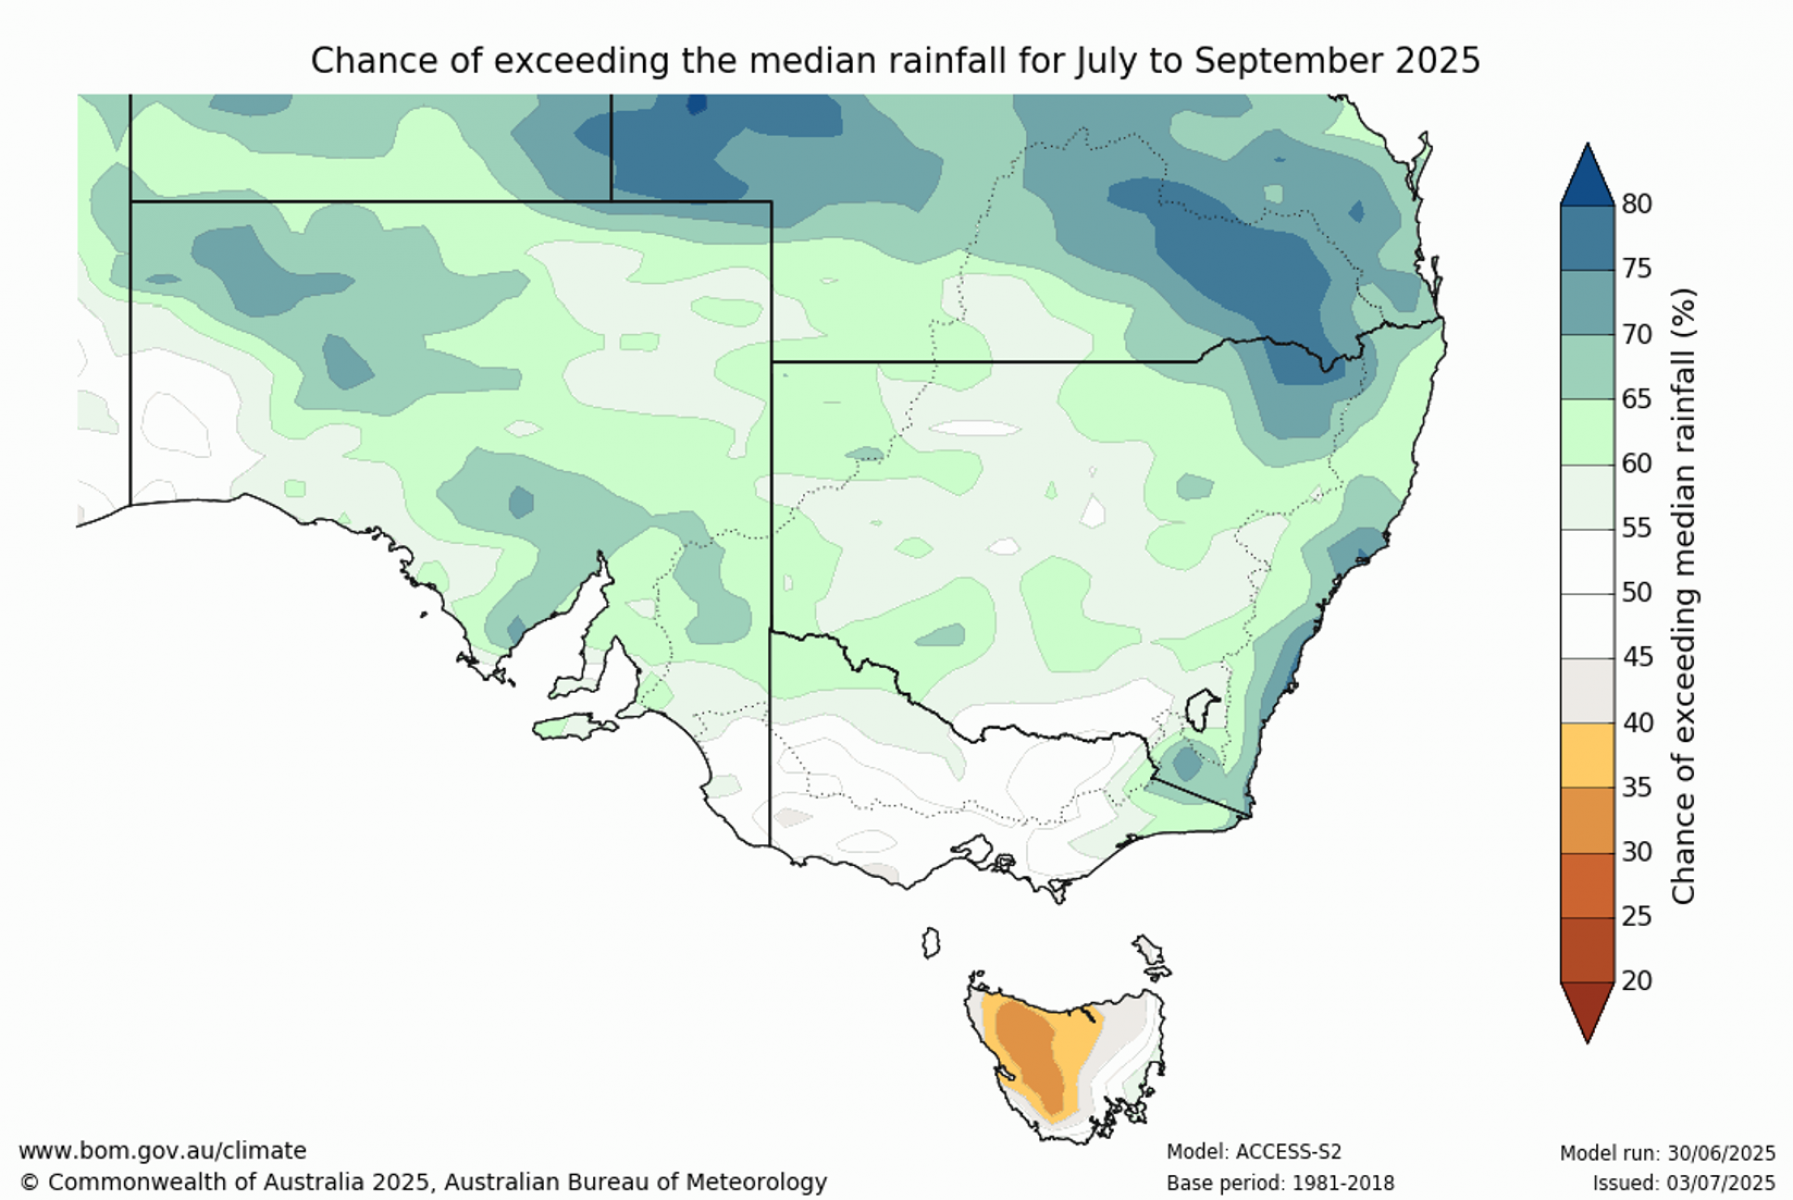
- There is an average chance (45-60%) of exceeding the median rainfall for July to September across most of Victoria. The likelihood is slightly higher in East Gippsland with a 60-70% chance.
- Maximum daily temperatures from July to September are very likely to exceed the median (>80% chance) across of Victoria, with a slightly weaker chance in East Gippsland.
- Updated on 11 July 2025. The next update is expected on 17 July 2025.
Climate driver update
Bureau of Meteorology climate driver update
- The Bureau's model forecasts neutral El Niño–Southern Oscillation (neither El Niño nor La Niña) until at least November.
- The Bureau's model predicts a neutral state of the IOD until at least August, after which it forecasts a brief shift towards a negative IOD before returning to neutral values.
- The Southern Annular Mode (SAM) is positive, as of 21 June. Models suggest the SAM is most likely to remain positive over the next fortnight. The SAM is likely to remain positive in July.
- Global SSTs remain substantially above average. Monthly averaged SSTs in 2025 have been the second warmest on record for each respective month, second only to temperatures recorded in 2024.
- Updated on 24 June 2025. The next update is expected on 17 July 2025.
Current urban restrictions
On 1 July 2025, Barwon Water eased Stage 3 restrictions for the Apollo Bay system. Stage 2 restrictions are now in place to allow local storages to continue to recover.
On 1 July 2025, Central Highlands Water announced Stage 2 restrictions for the Hepburn region, including Daylesford, Hepburn and Hepburn Springs to protect local storages.
On 28 May 2025, Goulburn Valley Water implemented stage 2 restrictions for Euroa and Violet Town.
Urban water corporations publish water restrictions on their websites.
Find your urban water corporation.
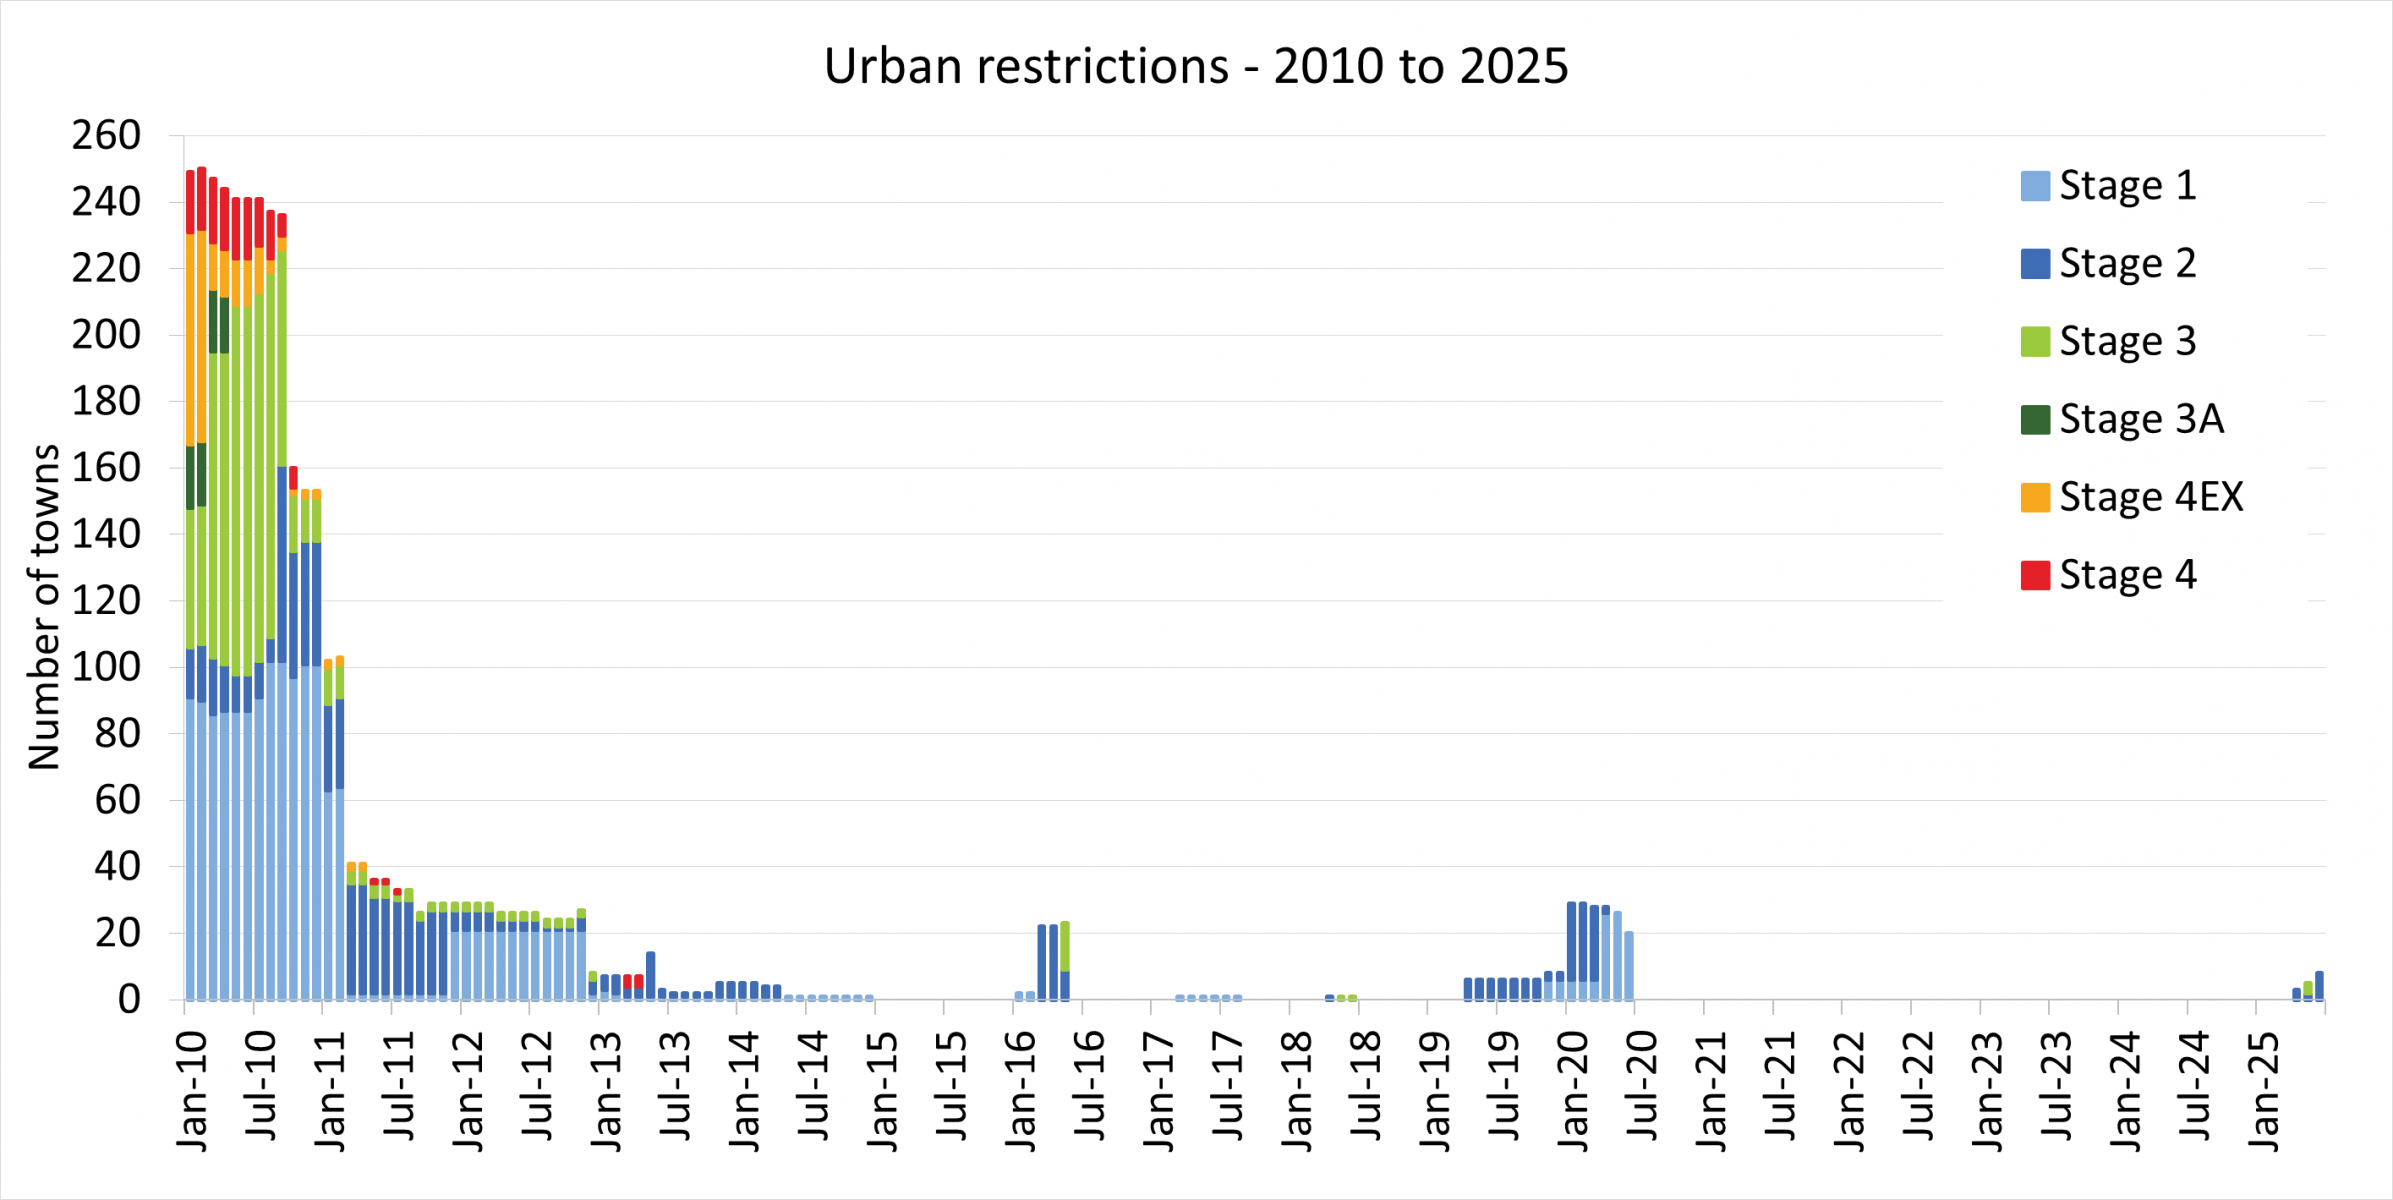
Monthly urban restrictions - 2010 to 2025
The graph and data below are updated at the end of each month.
Updated 4 July 2025. The next update is in early August 2025.
Graph of total number of towns on urban restrictions from January 2010 to May 2025
Stream restrictions
End-of-month stream restrictions - 2010 to 2025
As at 30 June 2025, there were 78 stream sections with restrictions or bans on licensed diversions across Victoria - 38 fewer than at the end of May 2025*. These are shown in red and purple in the map below.
Map of streams restricted as at 30 June 2025**
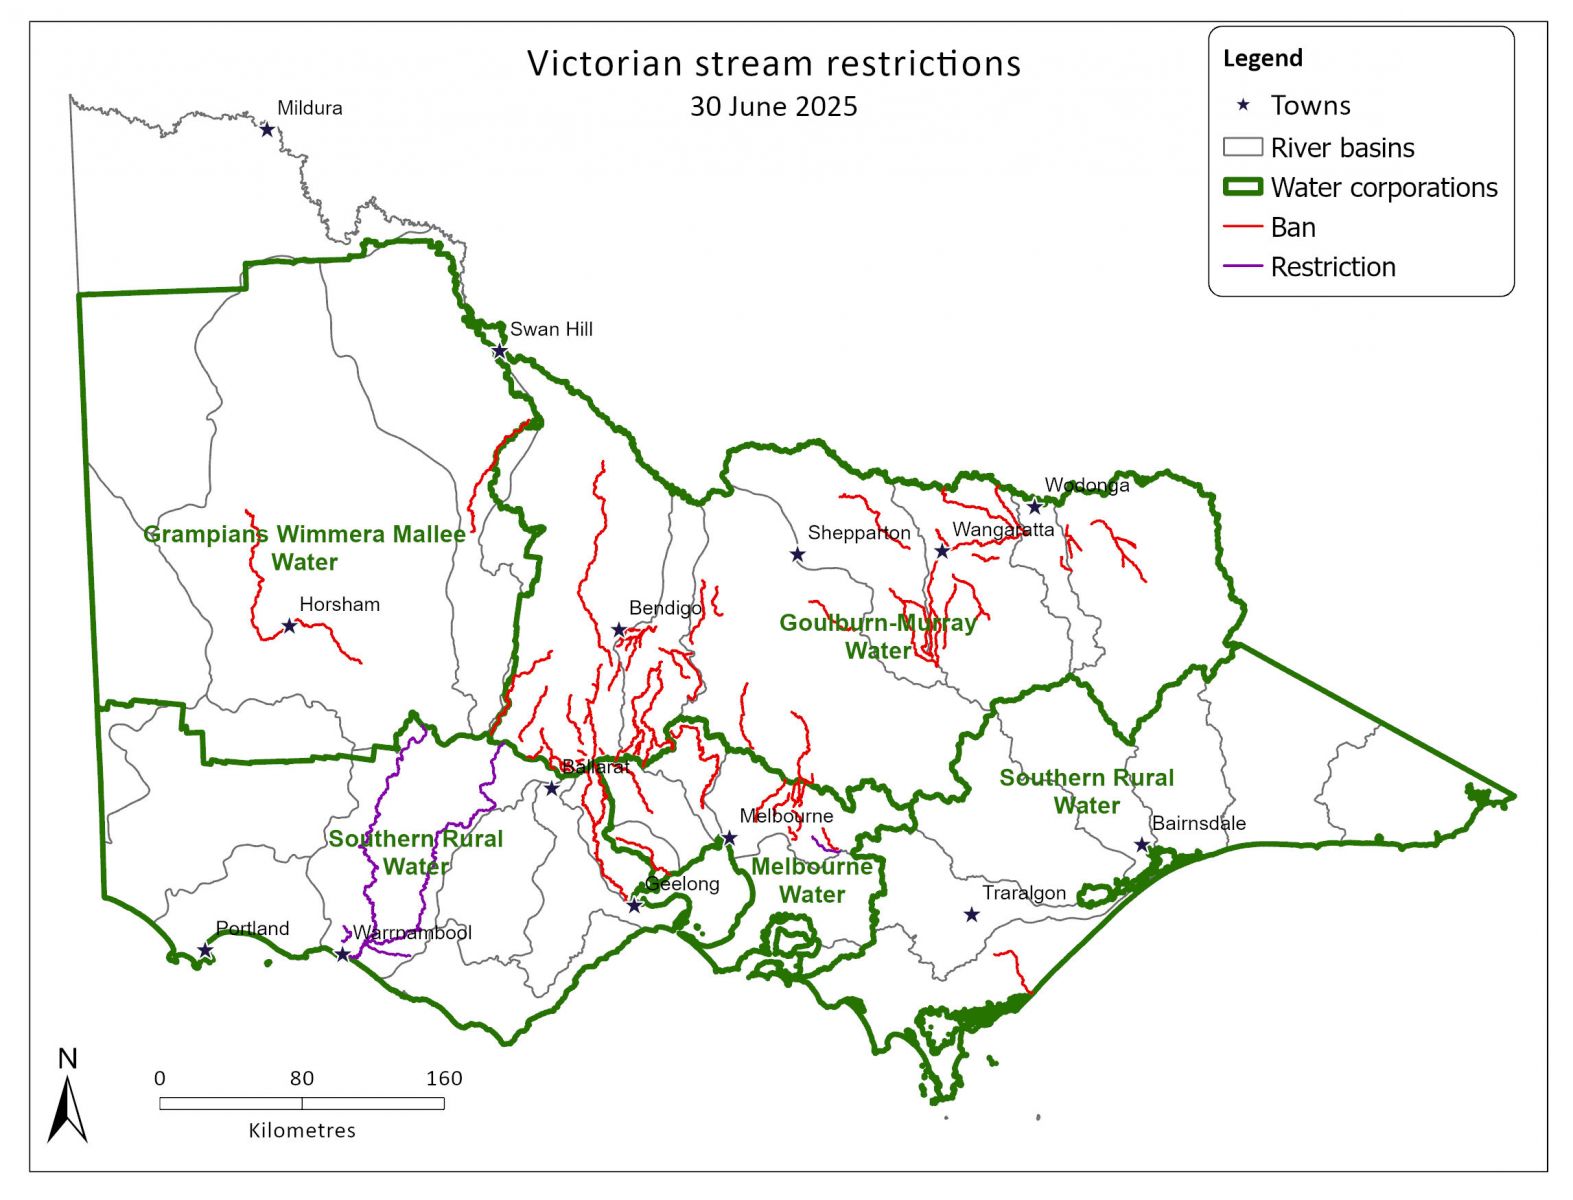
* This count includes management sections subject to diversion restrictions (the term used for partial limitation on take) as well as complete bans on take.
** This map is for indicative purposes only and licence holders should refer to their respective water corporation regarding stream restrictions. This map does not display all stream restrictions.
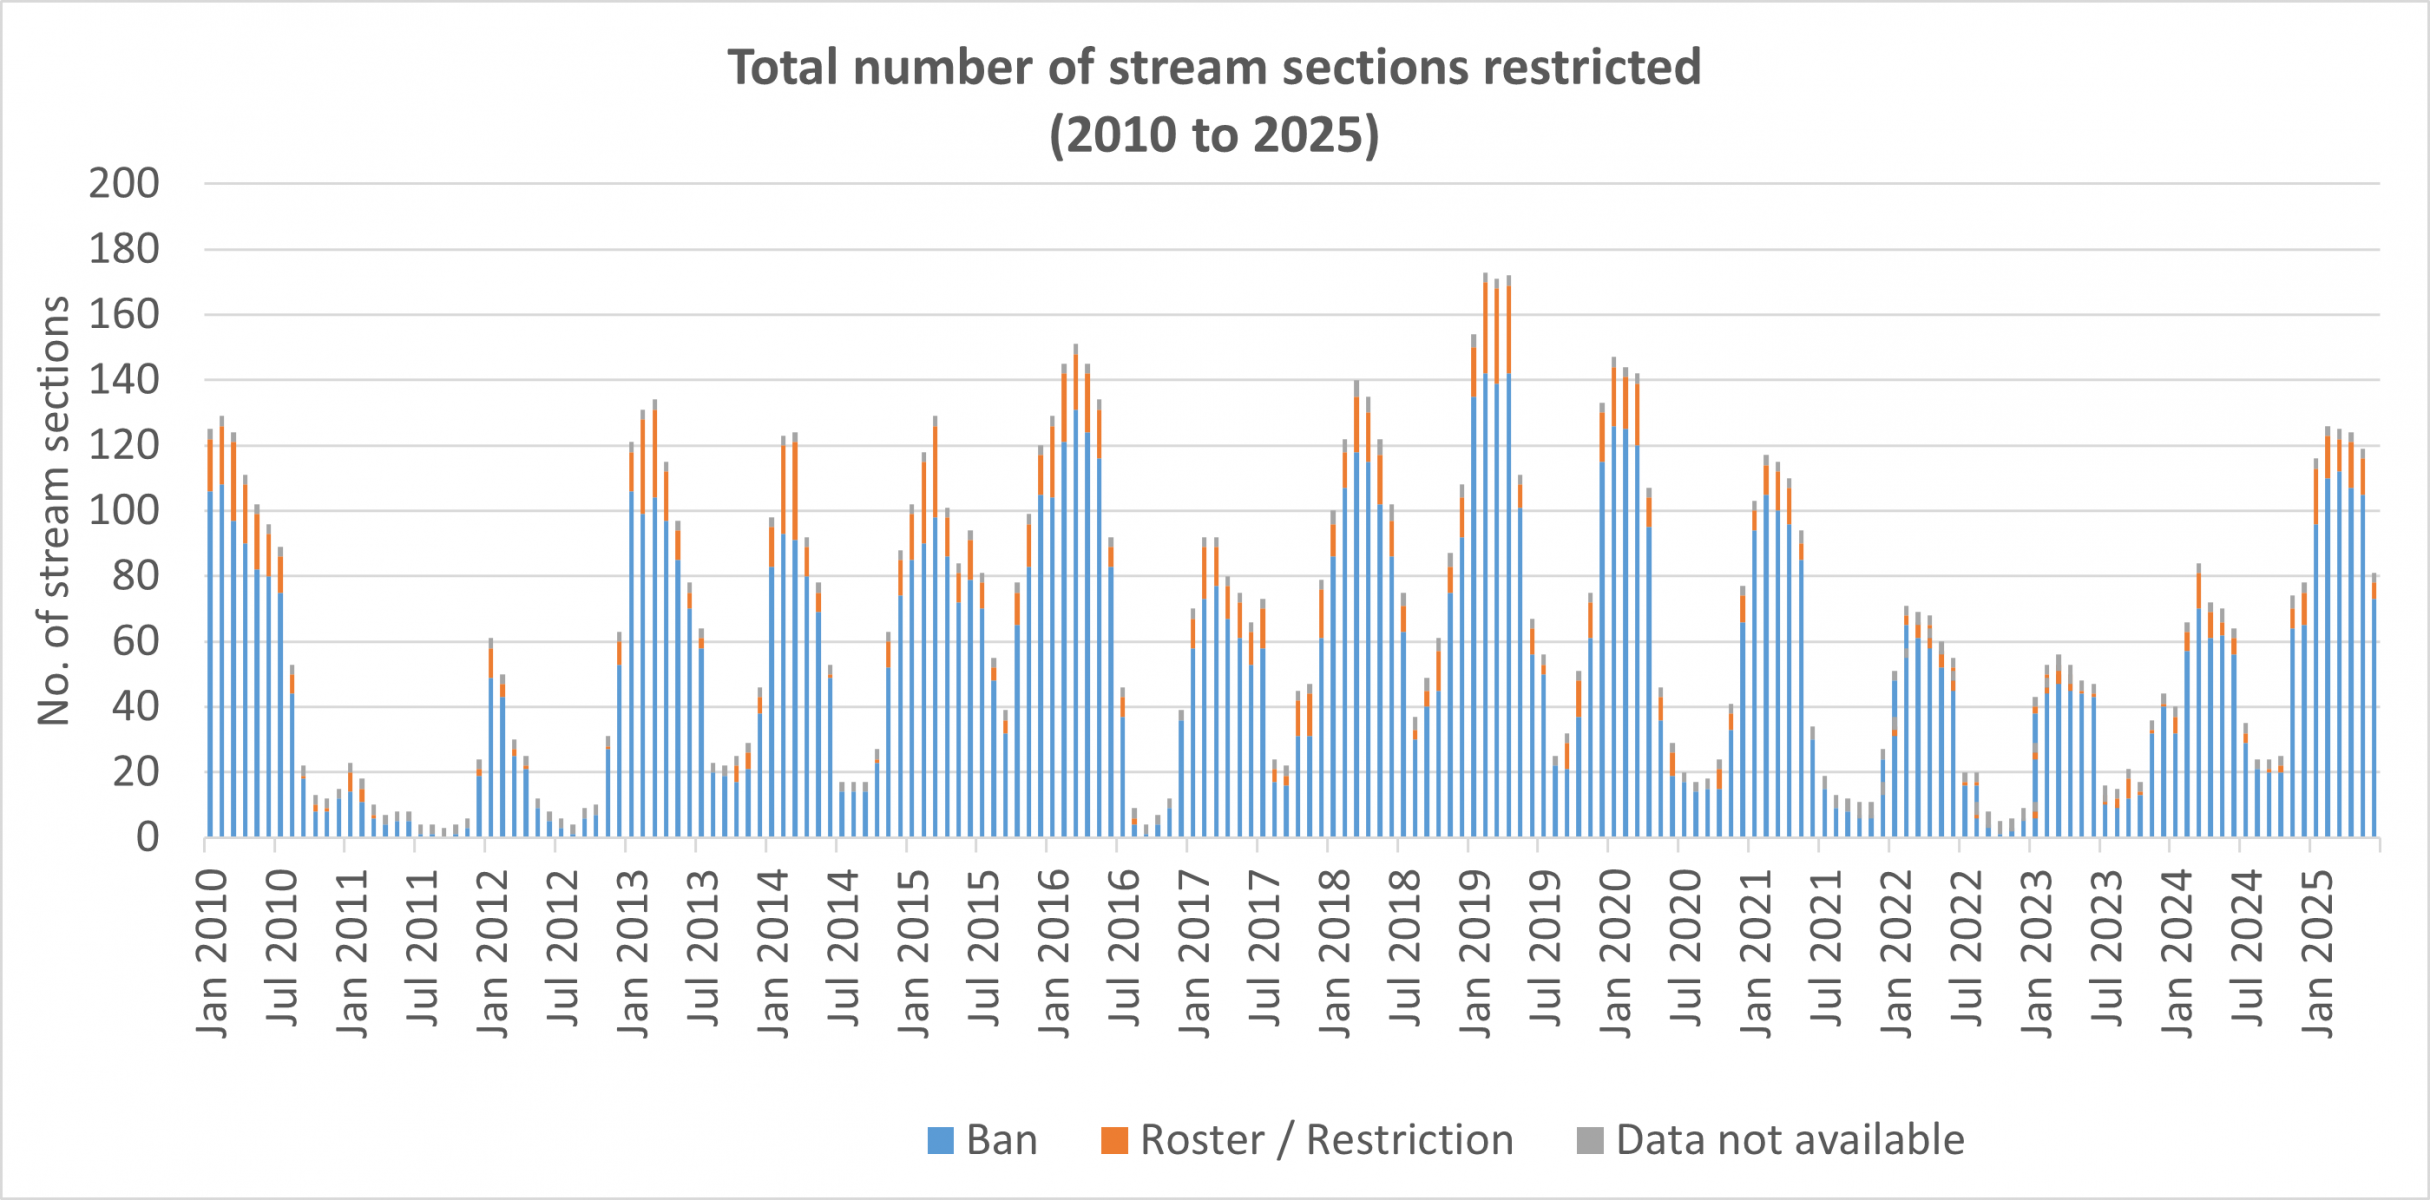
The graph and data below are as at the end of each month.
Updated 11 July 2025. The next update is early August 2025.
Graph of total number of stream sections restricted from January 2010 to June 2025
Groundwater summary
Quarterly groundwater level trend update
1 January to 31 March 2025 quarter.
Groundwater level trends in groundwater management units (GMUs) are reported quarterly. Groundwater level trends for GMUs have been determined based on 5 years (short-term) or 10 years (long-term) of consistent monitoring data from key bores in the State Observation Bore Network (SOBN).
There are 2 categories of GMUs:
- Groundwater management areas (GMAs).
- Water supply protection areas (WSPAs).
Updated 15 May 2025. The next update is August 2025 (for the April to June 2025 quarter).
Notes
- Trends are calculated mathematically using data with variable timescales, and do not necessarily represent the status of the resource for management purposes.
- There was insufficient data or monitoring bores available to determine a short-term and long-term trend in 10 GMAs.
- Glenelg WSPA was abolished in August 2022.
Short and long term groundwater level trend maps
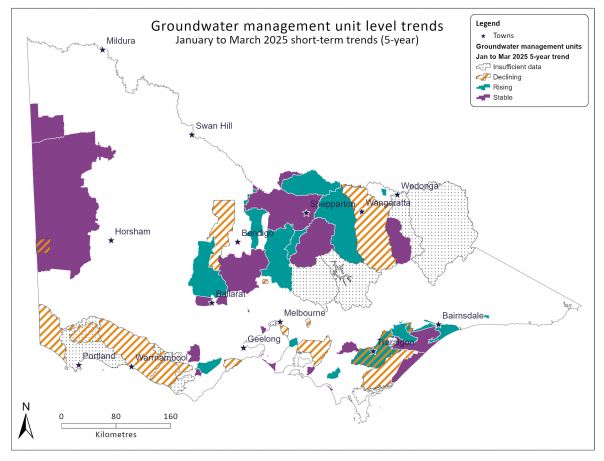
- Groundwater management unit short-term trends - January to March 2025 quarter
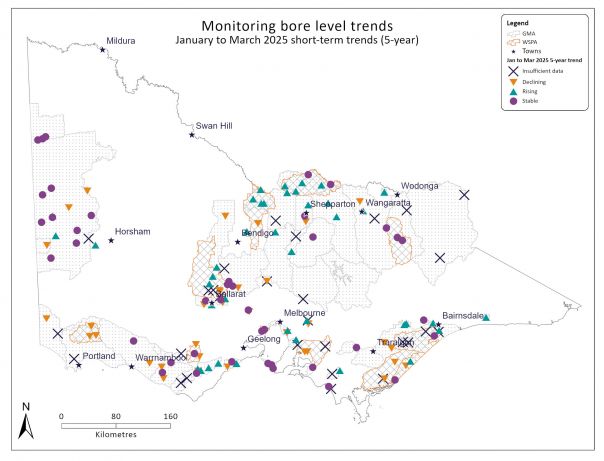
- State Observation Bore Network key bore short-term trends - January to March 2025 quarter

- Groundwater management unit long-term trends - January to March 2025 quarter
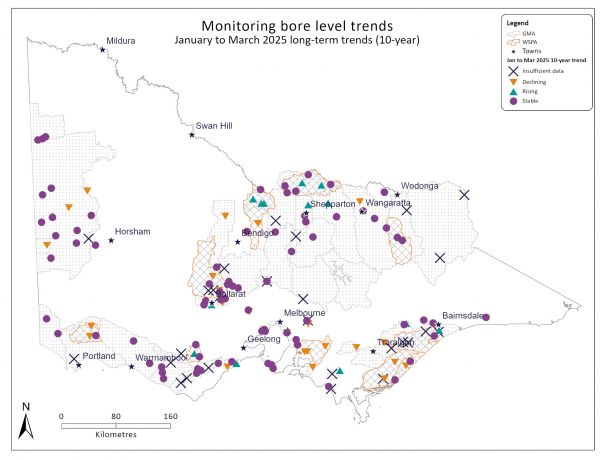
- State Observation Bore Network key bore long-term trends - January to March 2025 quarter
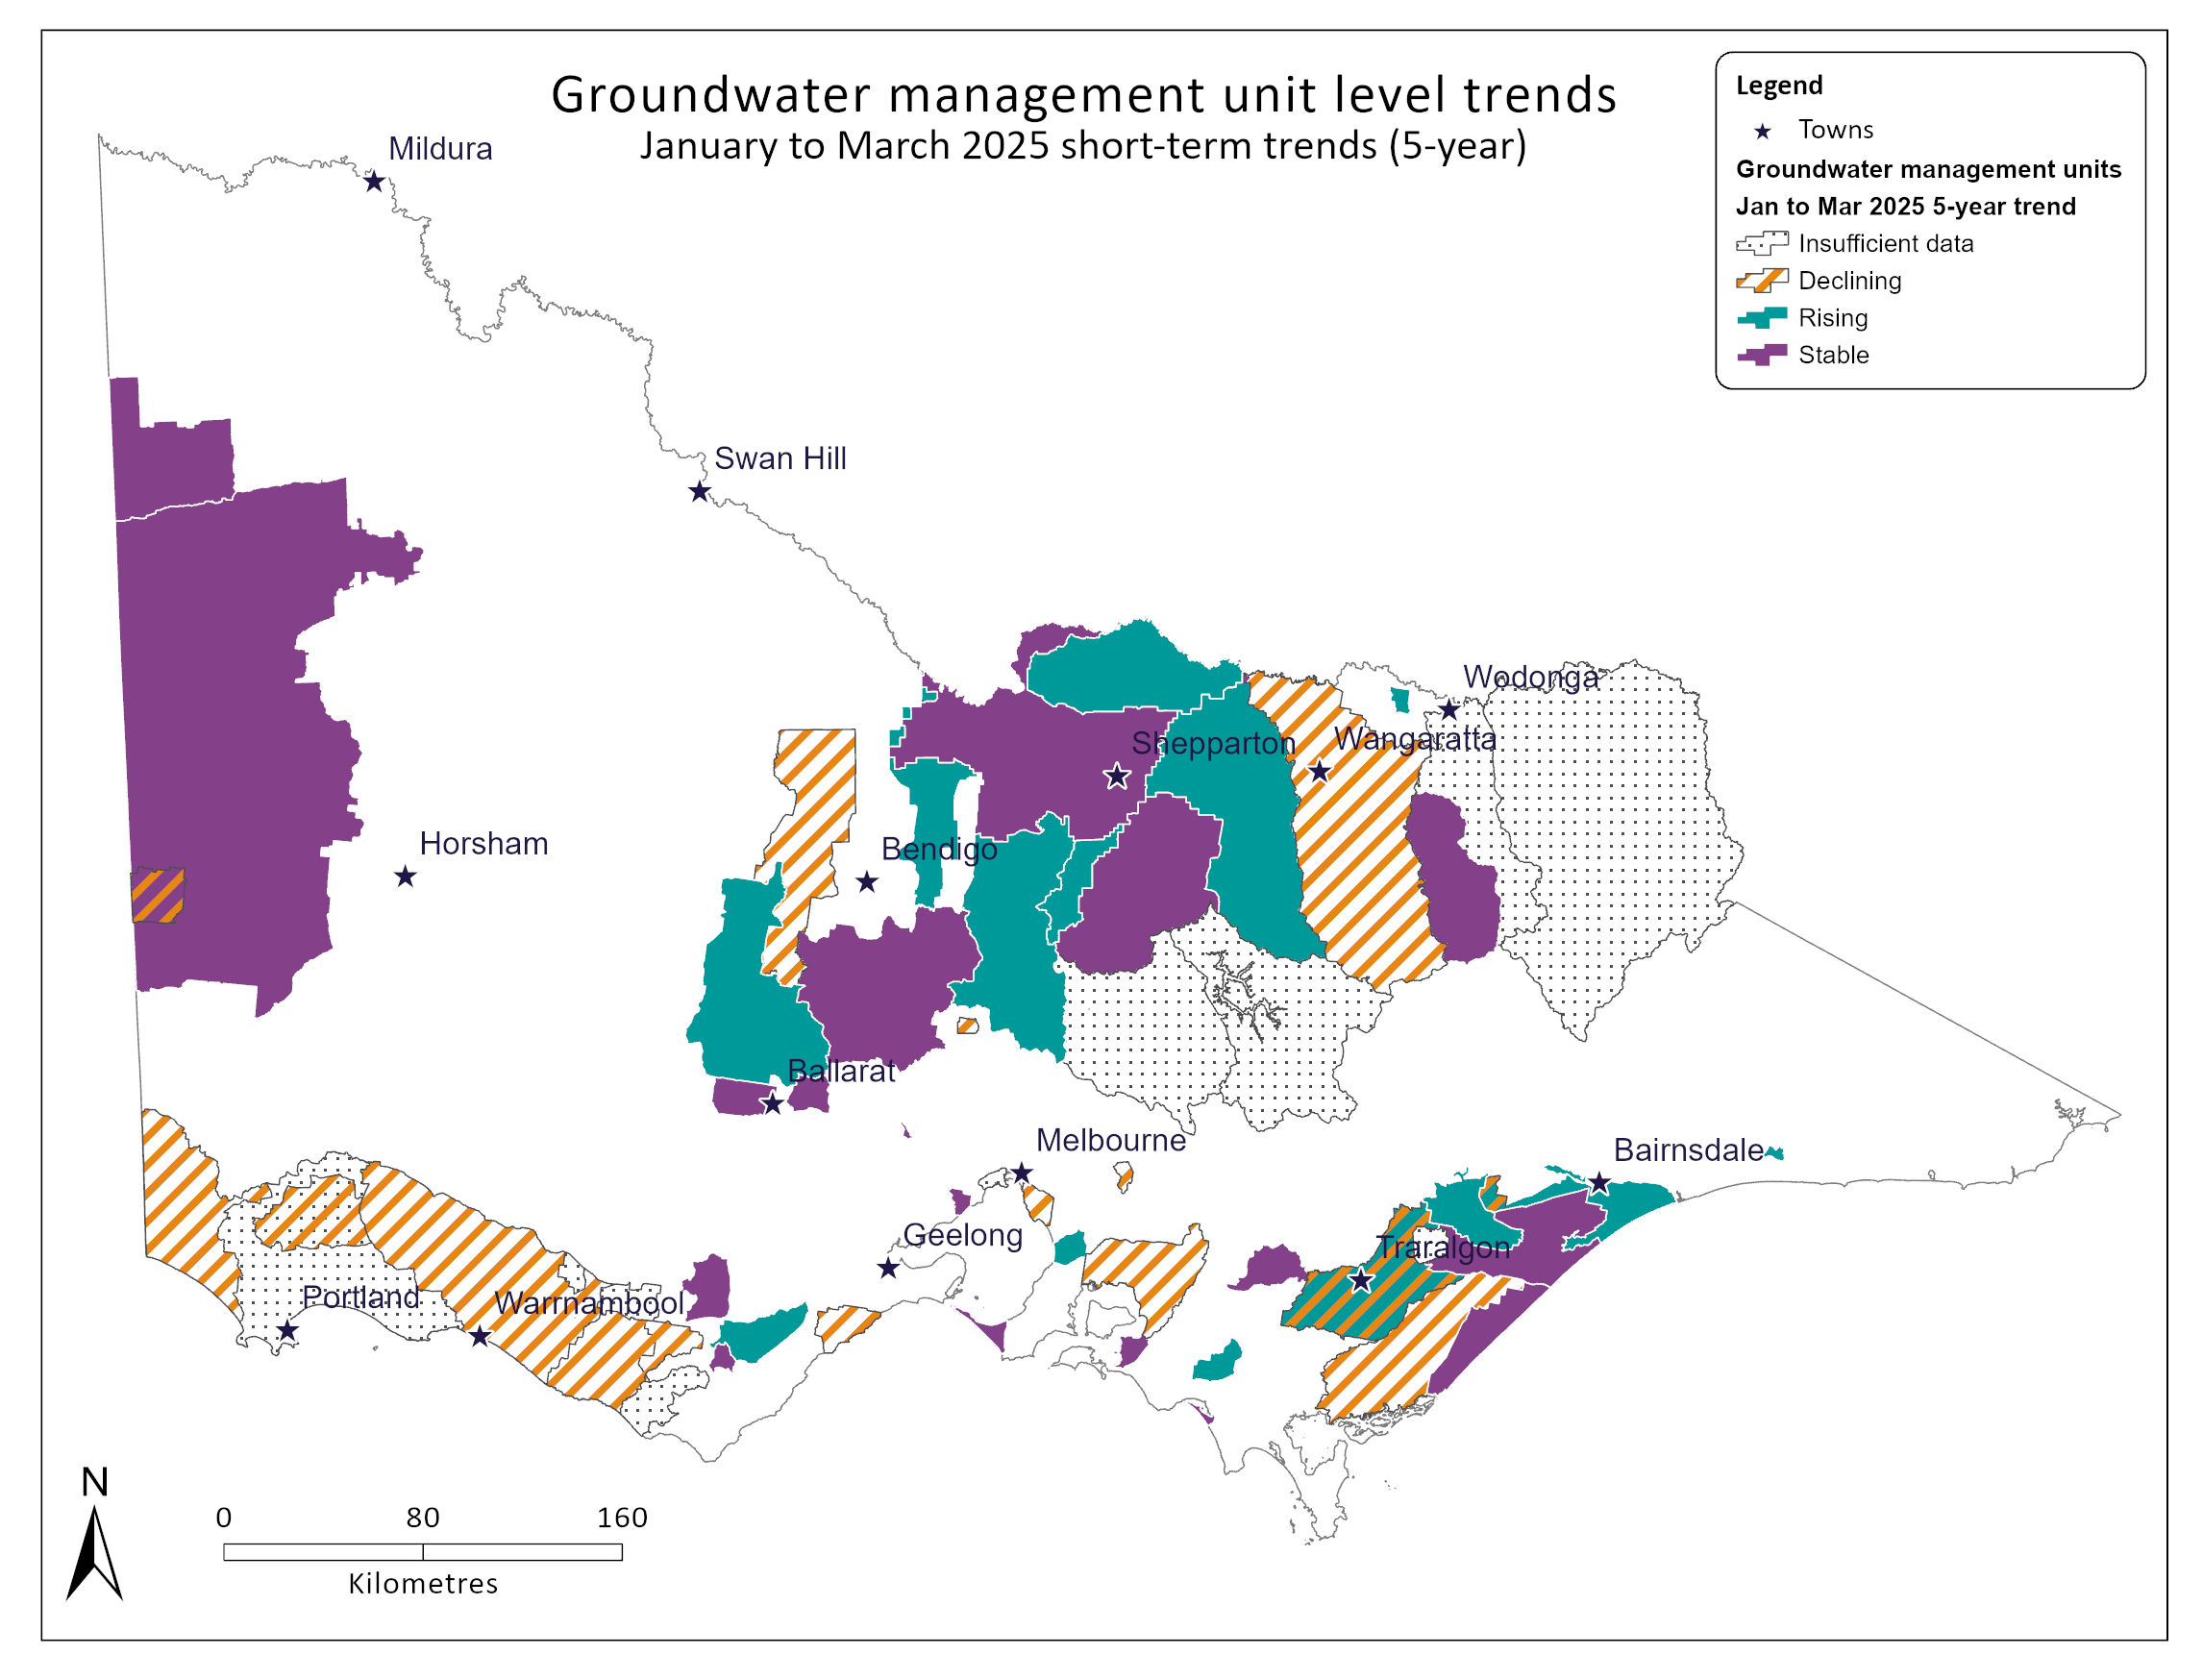
Groundwater management unit short-term trends - January to March 2025 quarter
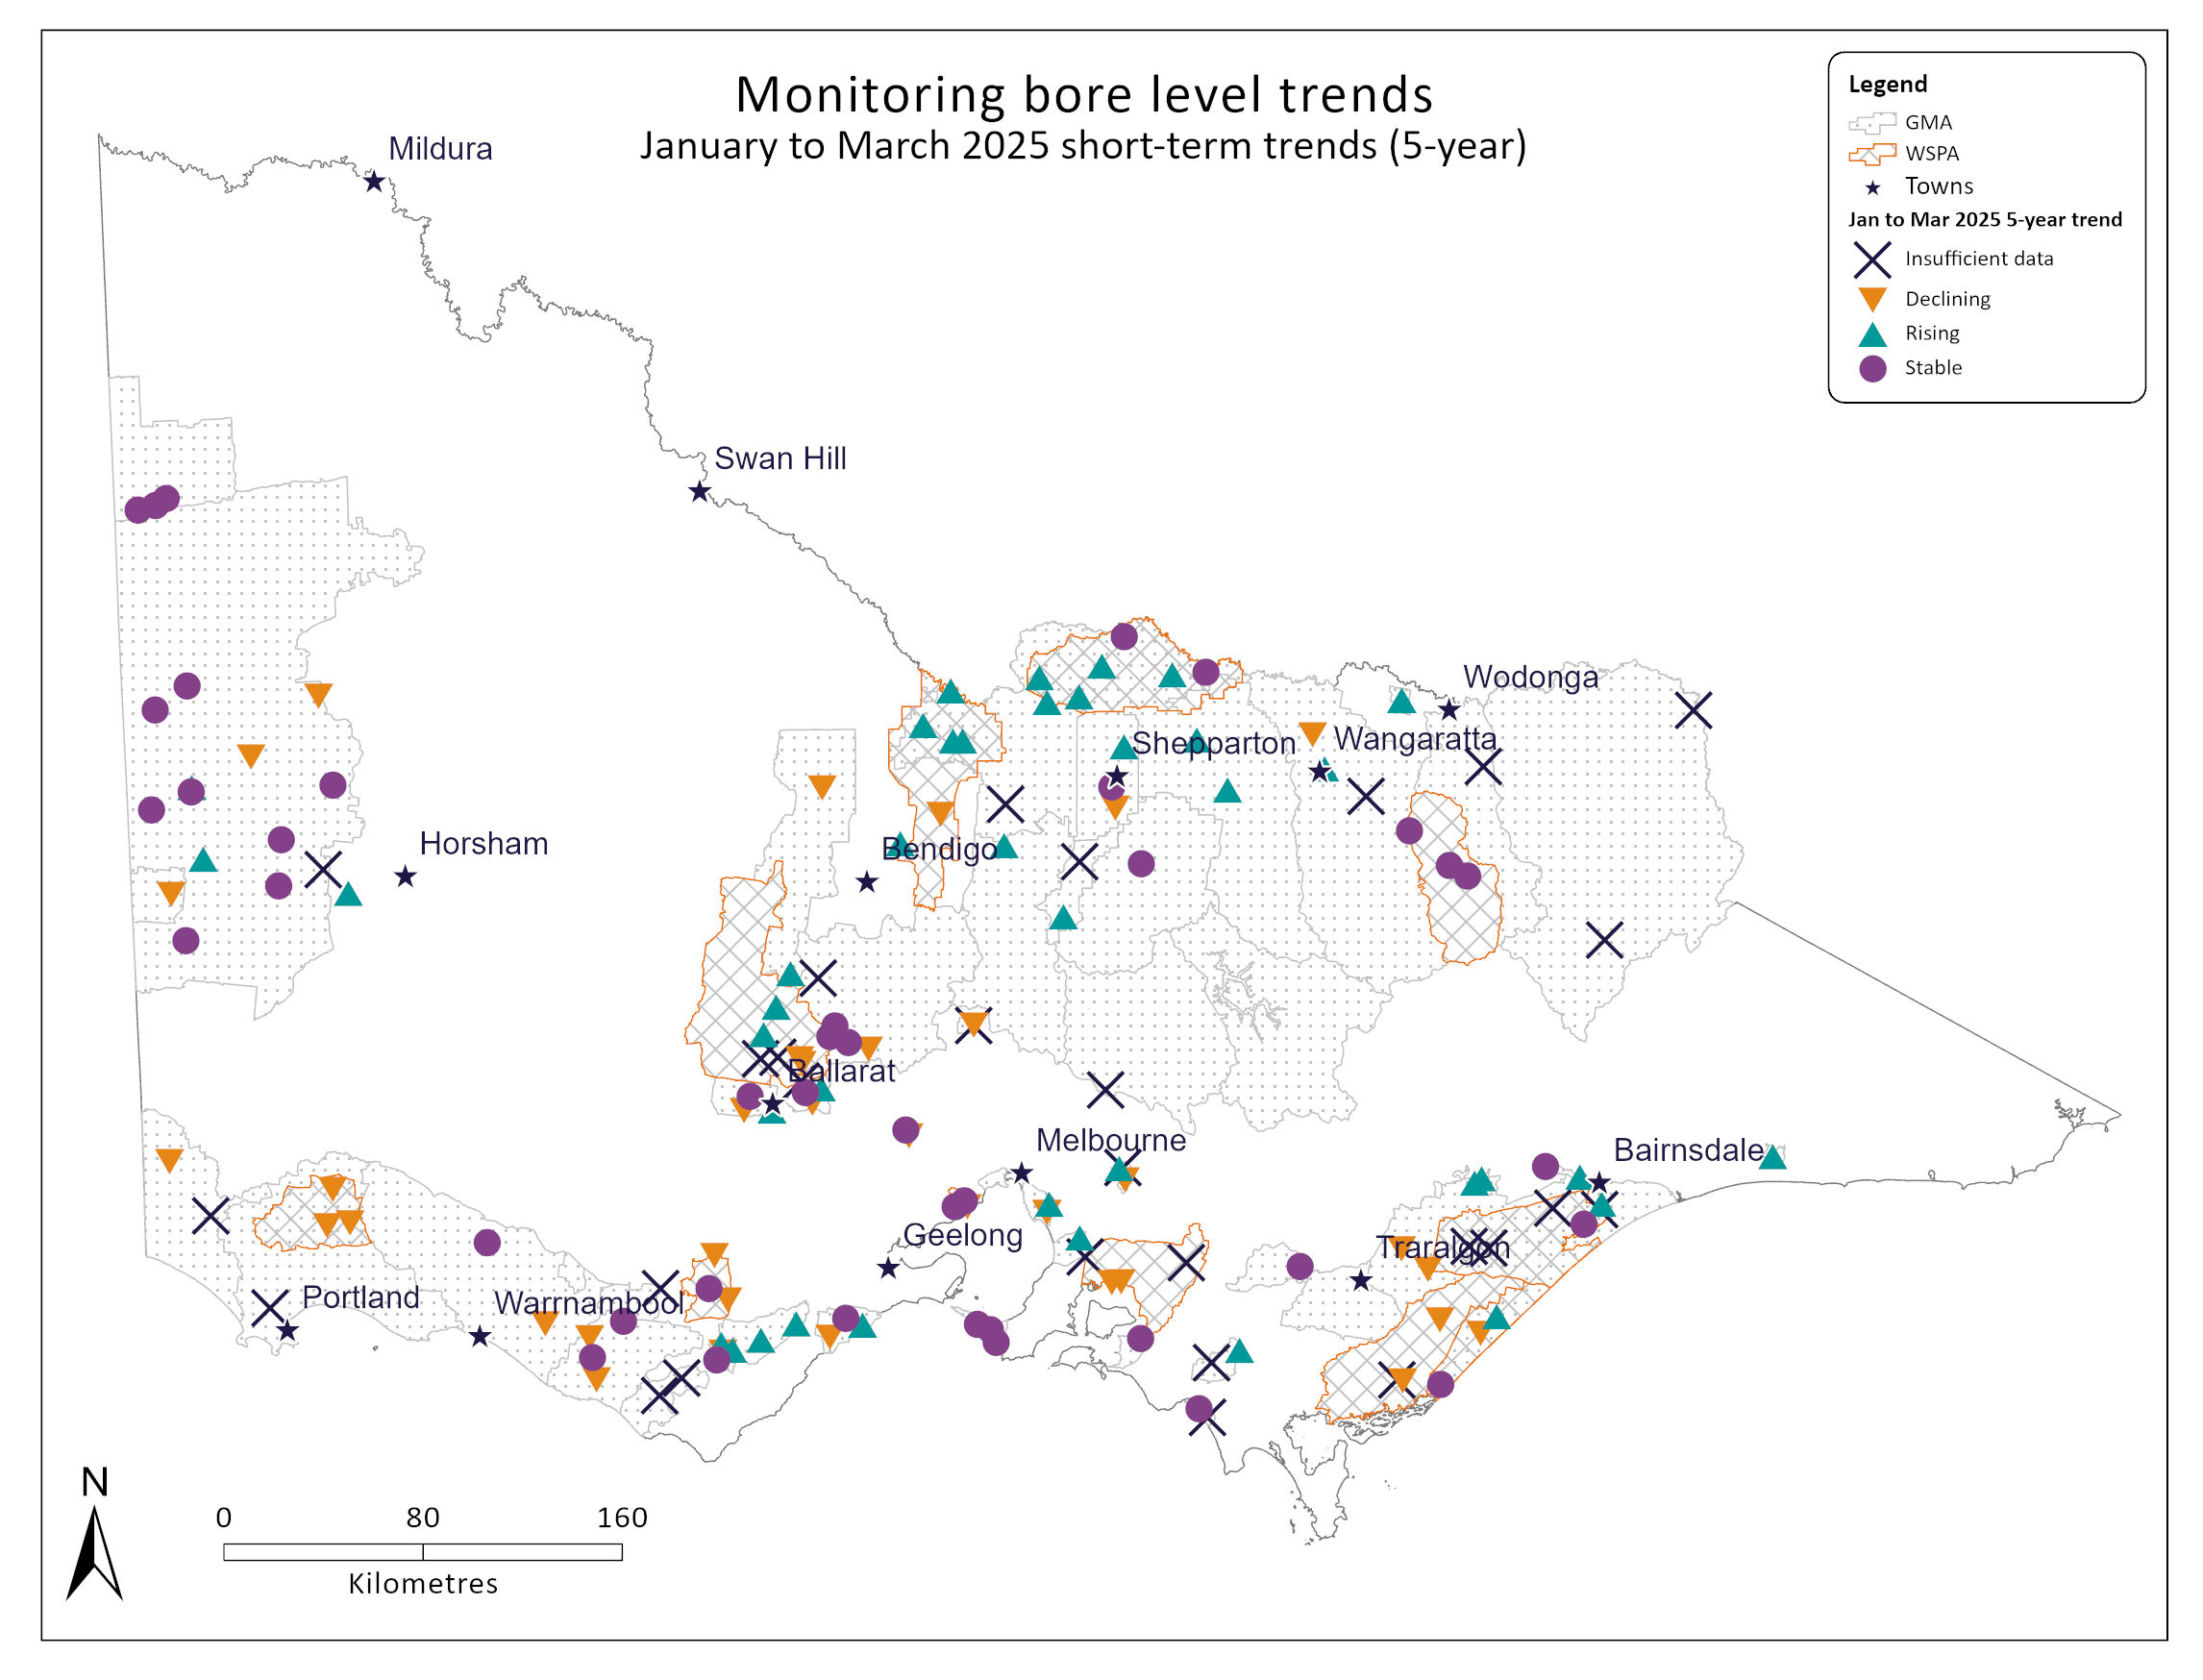
State Observation Bore Network key bore short-term trends - January to March 2025 quarter
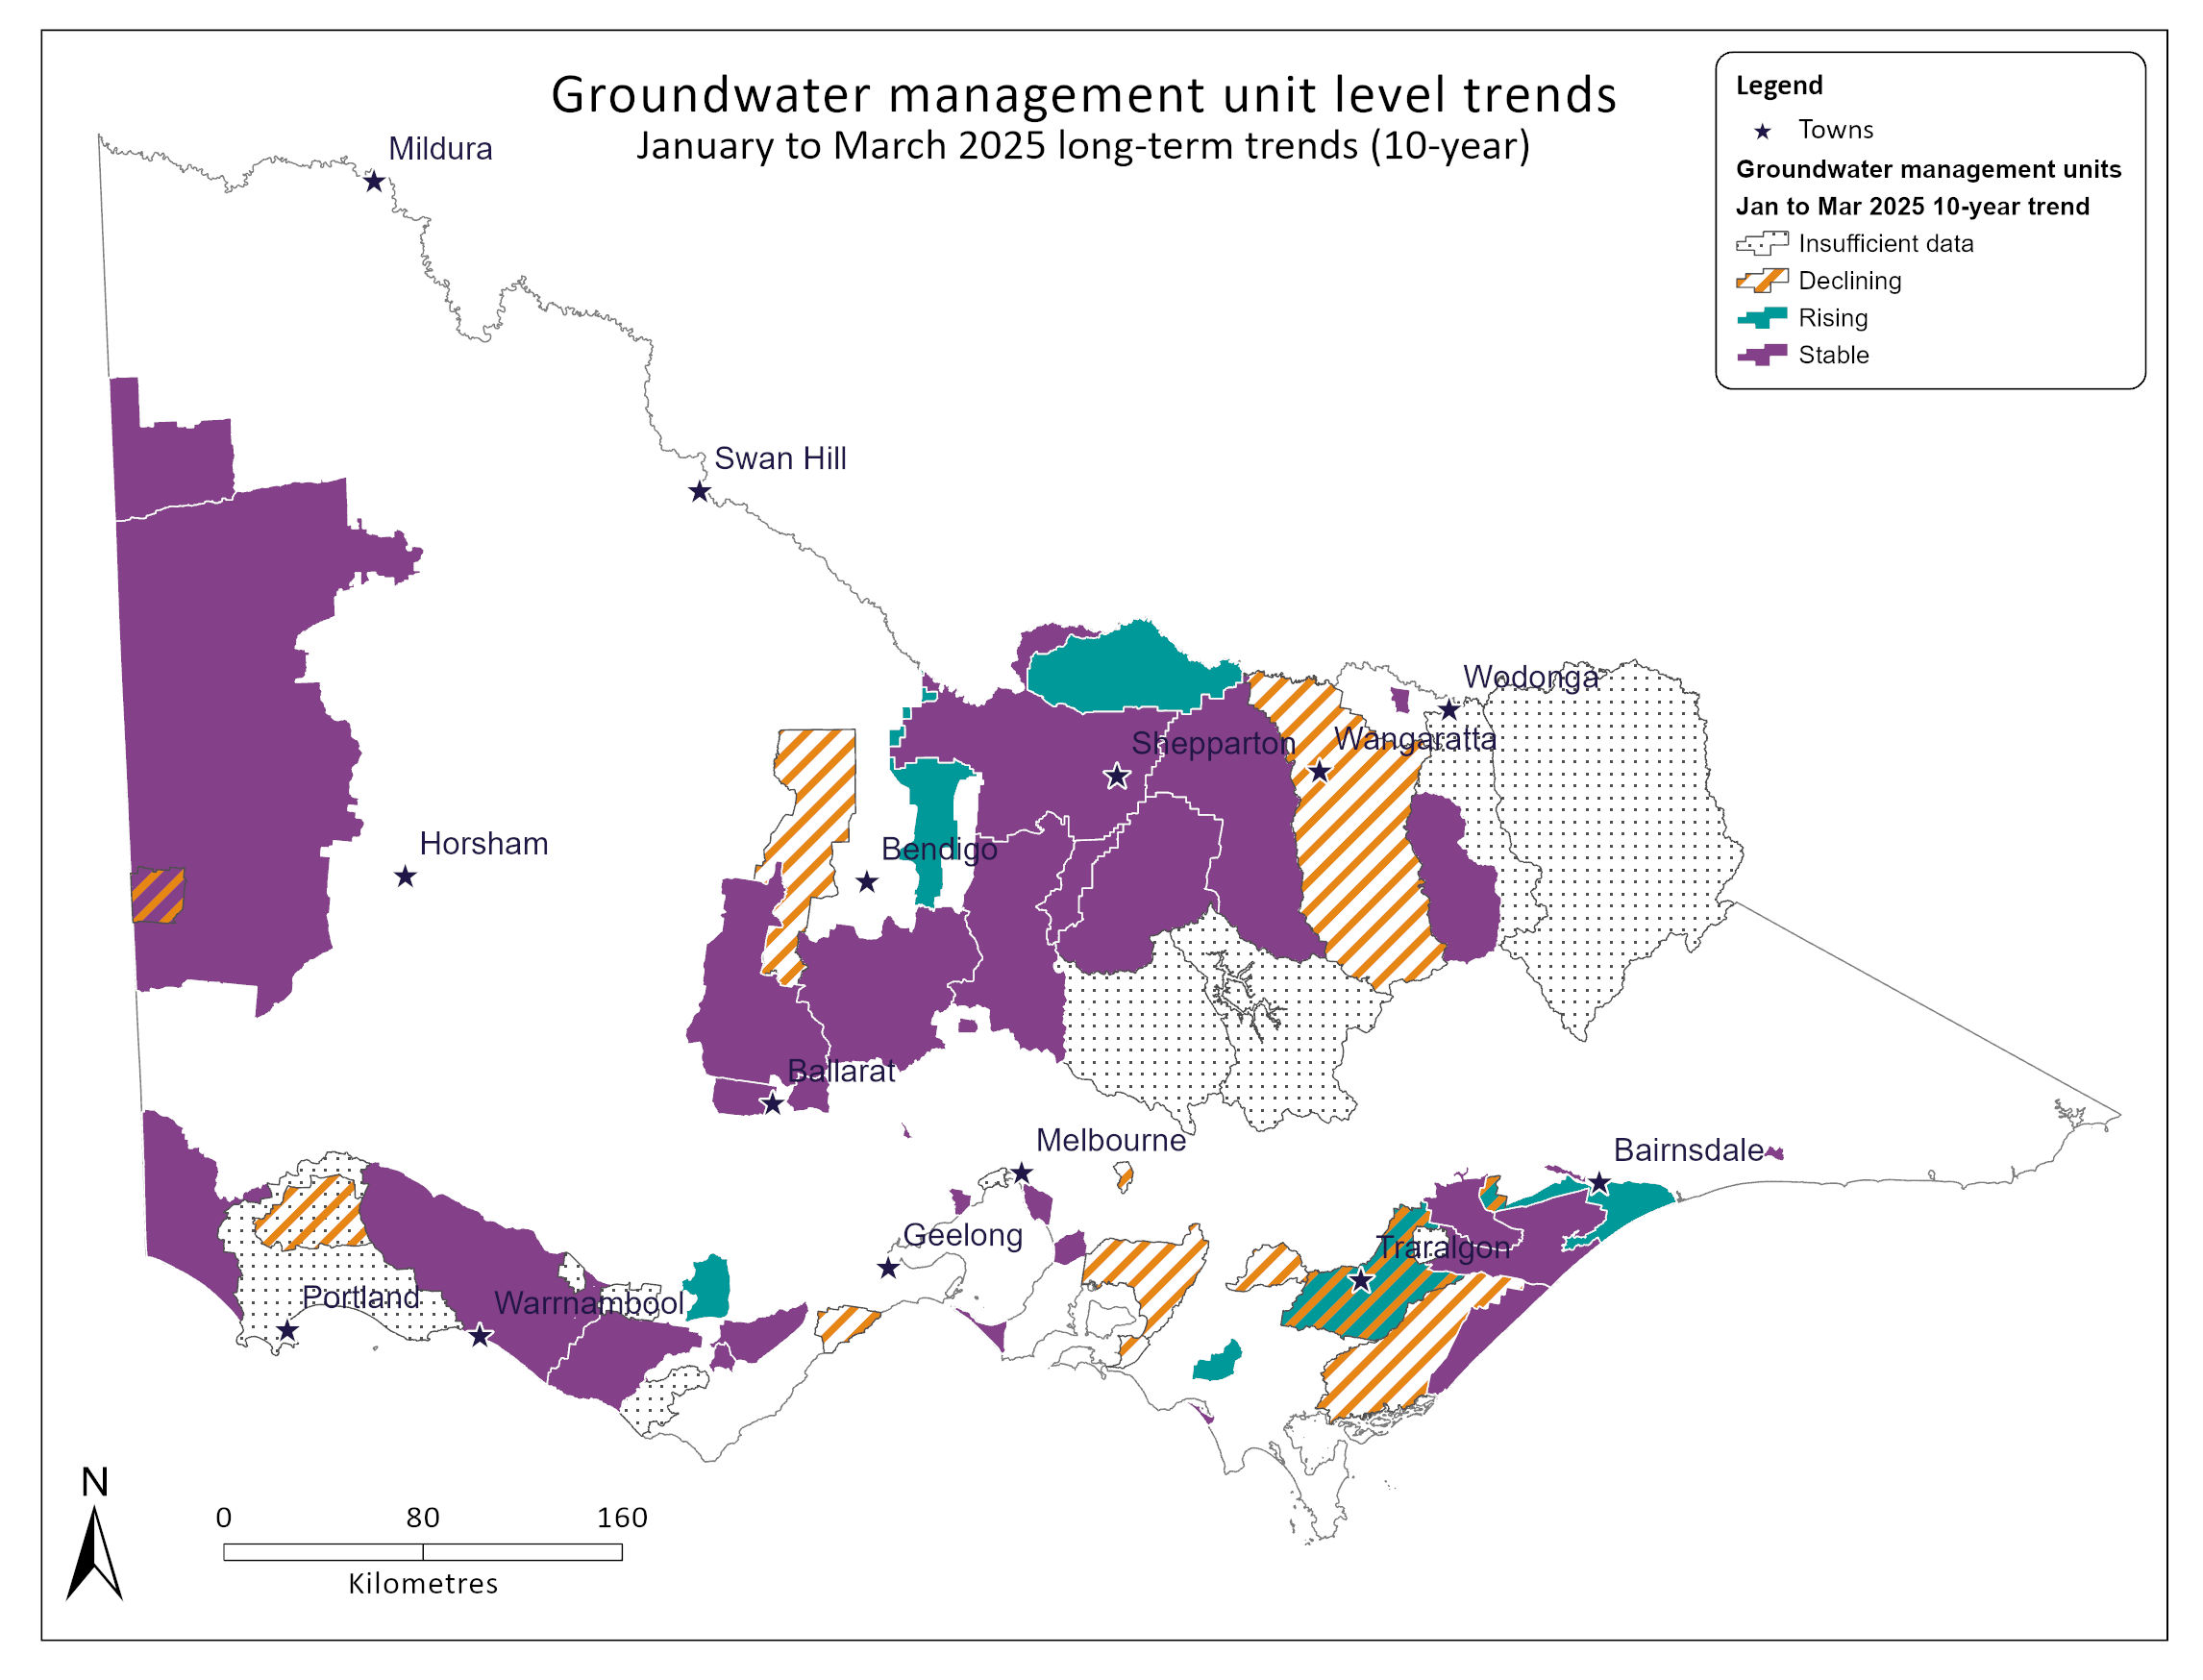
Groundwater management unit long-term trends - January to March 2025 quarter

State Observation Bore Network key bore long-term trends - January to March 2025 quarter
Groundwater restrictions
In 2024-25, 3 GMUs were subject to allocation restrictions:
- Barnadown (Lower Campaspe Valley WSPA) at 75%.
- Deutgam WSPA at 50%.
- Neuarpur subzone 1 (West Wimmera GMA) at 80%.
Updated 4 July 2024. The next update is July 2025.
Seasonal determinations and allocations
Seasonal determinations are made against water shares to provide allocations in declared systems. These can be for high reliability (HRWS) or low reliability (LRWS) water shares. In northern Victoria, Goulburn-Murray Water makes the seasonal determinations in the relevant systems, while Southern Rural Water makes the seasonal determinations in the Thomson/Macalister and Bacchus Marsh/Werribee systems.
In the Grampians Wimmera Mallee Water area, resource assessments are undertaken every month to determine the amount of water that can be made available to entitlement holders. These monthly assessments result in a formal announcement on water allocations.
Coliban Water assesses seasonal allocations for customers on its rural network based on available resources in the Coliban System.
Goulburn-Murray Water
| System | Seasonal determinations HRWS | Seasonal determinations LRWS | Date updated |
|---|---|---|---|
| Murray | 39% | 0% | 1 July 2025 |
| Broken | 0% | 0% | 1 July 2025 |
| Goulburn | 31% | 0% | 1 July 2025 |
| Campaspe | 100% | 0% | 1 July 2025 |
| Loddon | 31% | 0% | 1 July 2025 |
| Bullarook | 0% | 0% | 1 July 2025 |
Southern Rural Water
| System | Seasonal determinations HRWS | Seasonal determinations LRWS | Date updated |
|---|---|---|---|
Bacchus Marsh / Werribee | 45% | 0% | 1 July 2025 |
| Thomson / Macalister | 50% | 0% | 1 July 2025 |
Grampians Wimmera Mallee Water
| System | Seasonal determinations | Date updated |
|---|---|---|
| Wimmera-Mallee Pipeline Product | 0% | 4 July 2025 |
Coliban Water
| System | Seasonal determinations | Date updated |
|---|---|---|
| Coliban Rural System | 30% | 2 July 2025 |
Page last updated: 11/07/25