On this page:
The status of the state’s water resources across various categories, including storage levels, rainfall and seasonal outlooks.
Water storage levels
As at 25 November 2025, total combined storage levels for major Melbourne, regional and statewide storage networks were as follows:
- Melbourne: 75% full (13% lower than the previous year).
- Regional: 58% full (19% lower than the previous year).
- Statewide: 61% full (18% lower than the previous year).
Metro Melbourne water storage levels
Northern Victoria water storage levels
* Victoria has a 50% share of inflows to Dartmouth and in Hume
Southern and Western Victoria water storage levels
* Werribee Basin storage value is the combined volume of the Melton, Merrimu and Pykes reservoirs
Download the monthly dataset
Updated 20 November 2025. The next update is in mid-December 2025.
Regional, Melbourne and all Victoria monthly storage levels
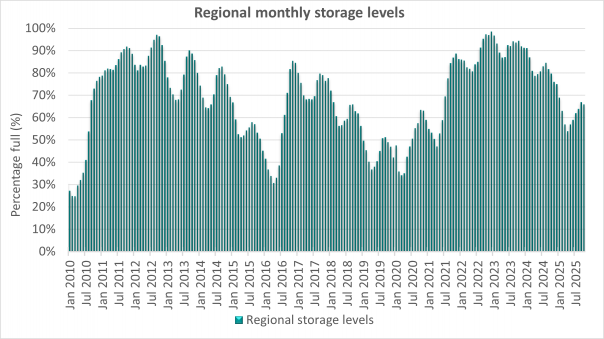
- Regional monthly storage levels - end January 2010 to end October 2025

- Melbourne monthly storage levels - end January 2010 to end October 2025
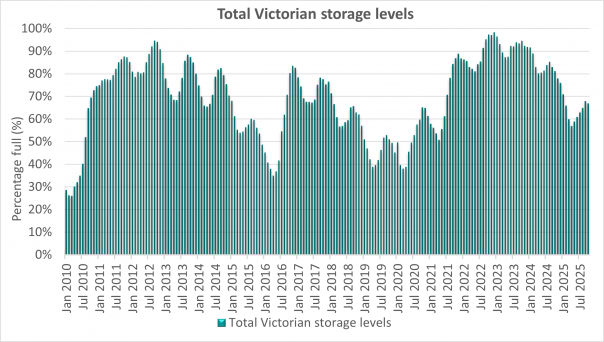
- Total Victorian monthly storage levels - end January 2010 to end October 2025
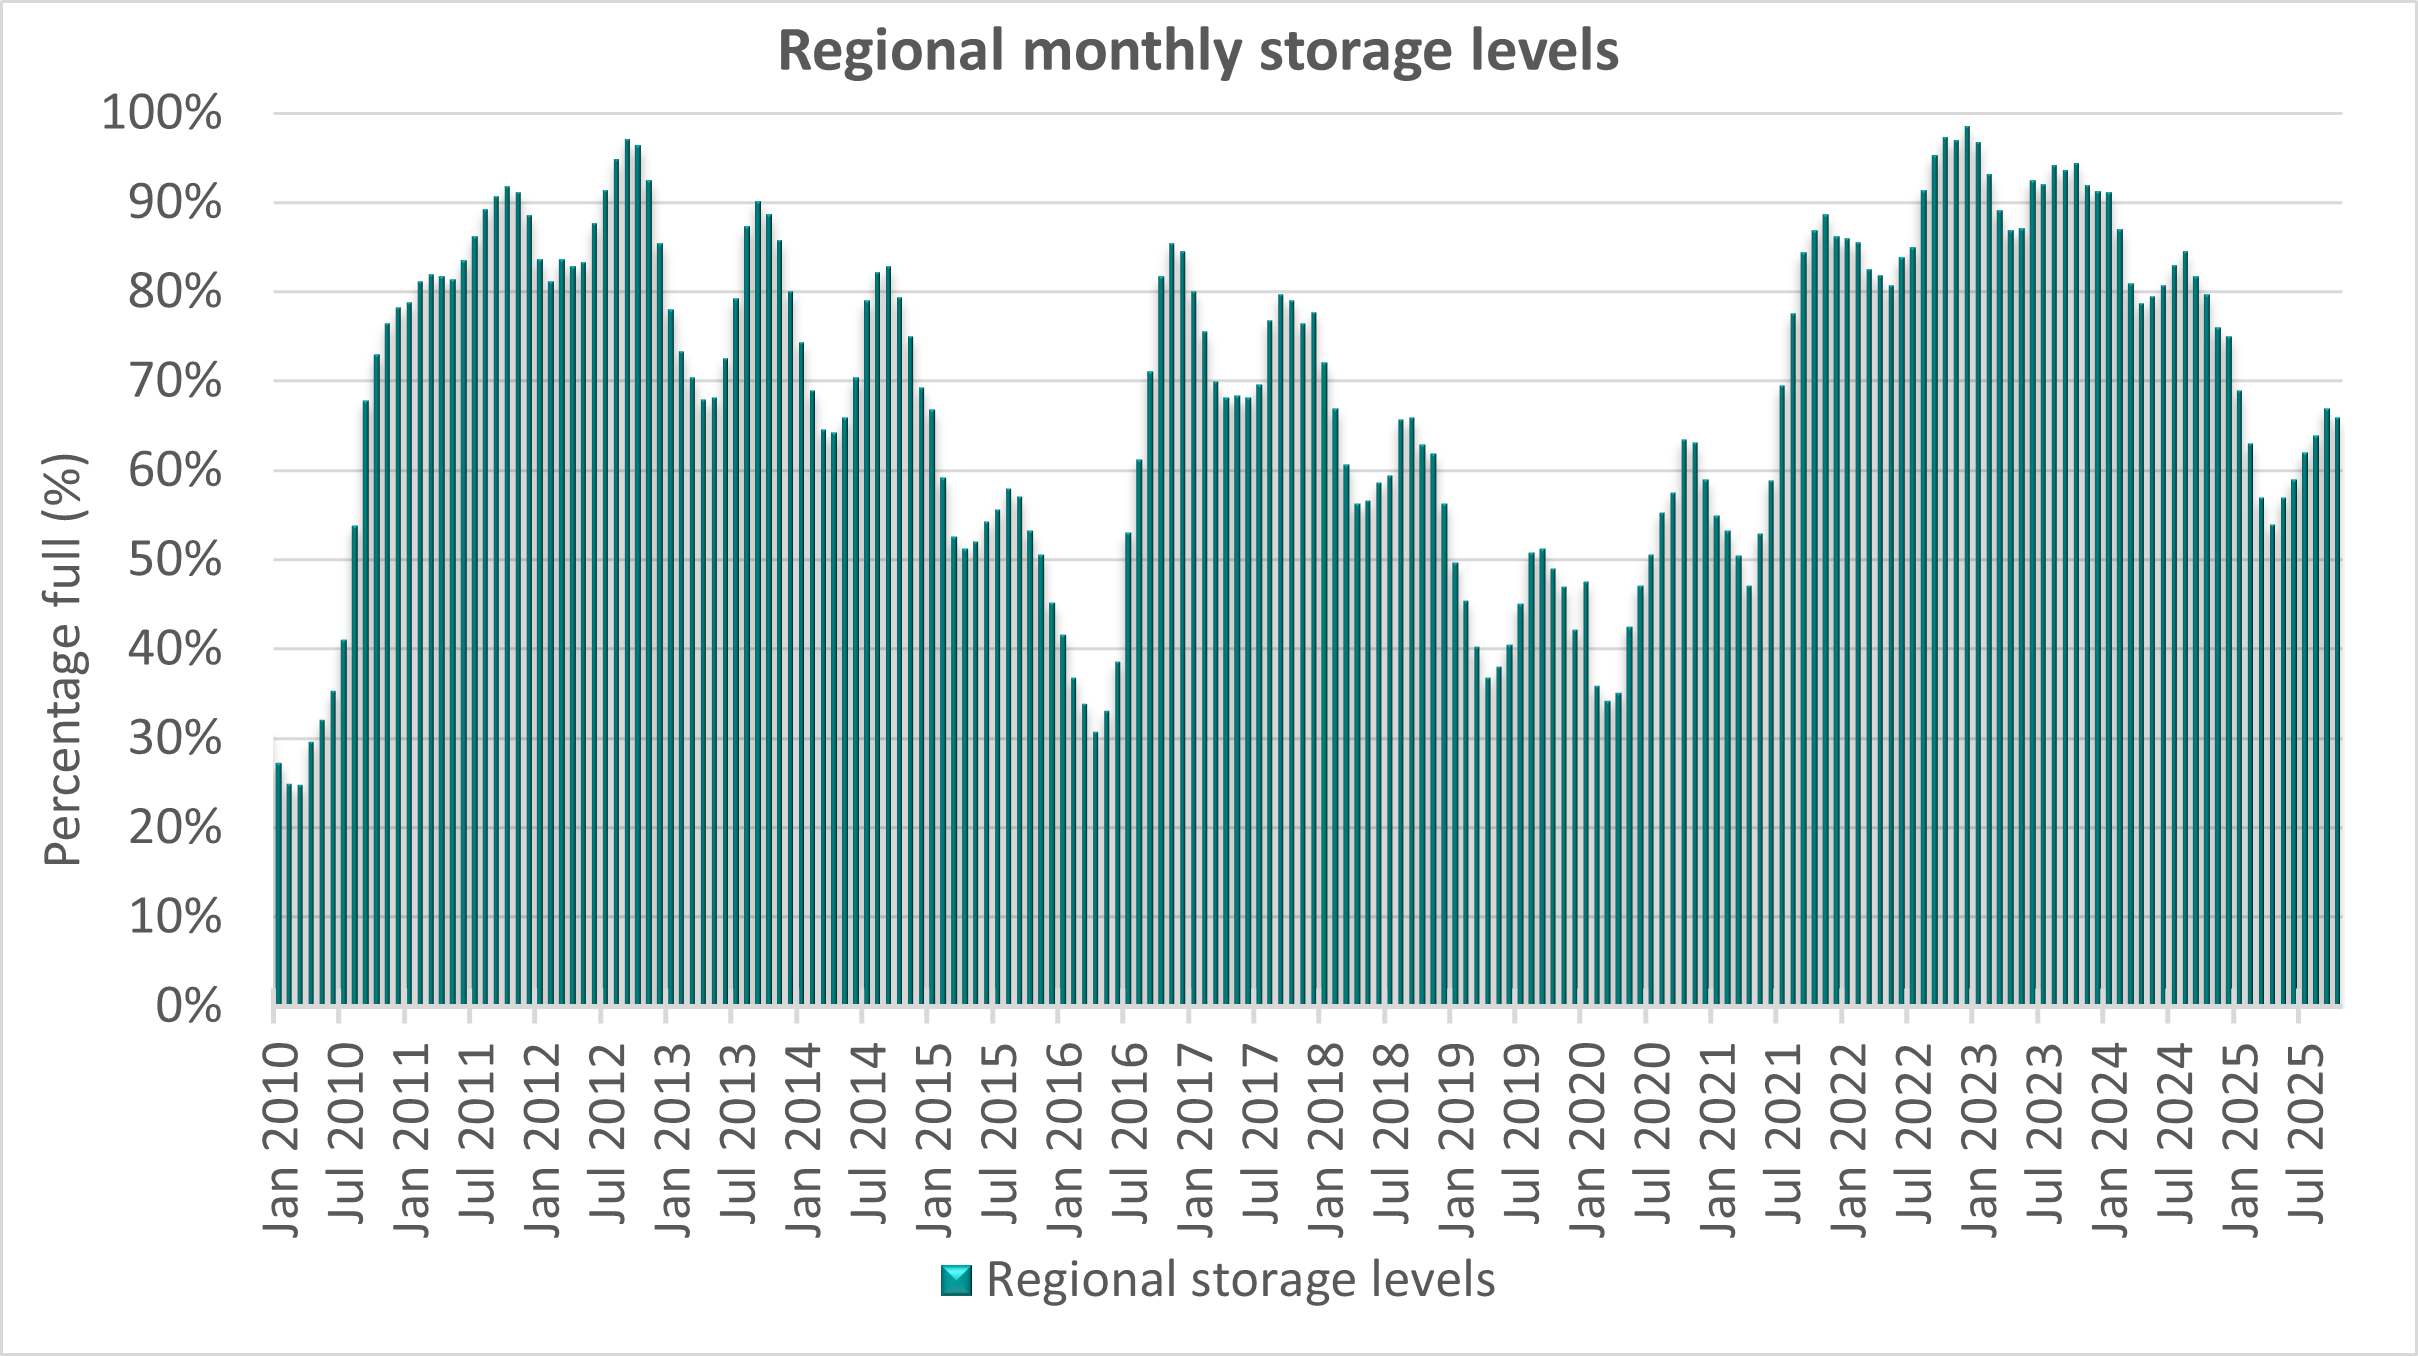
Regional monthly storage levels - end January 2010 to end October 2025
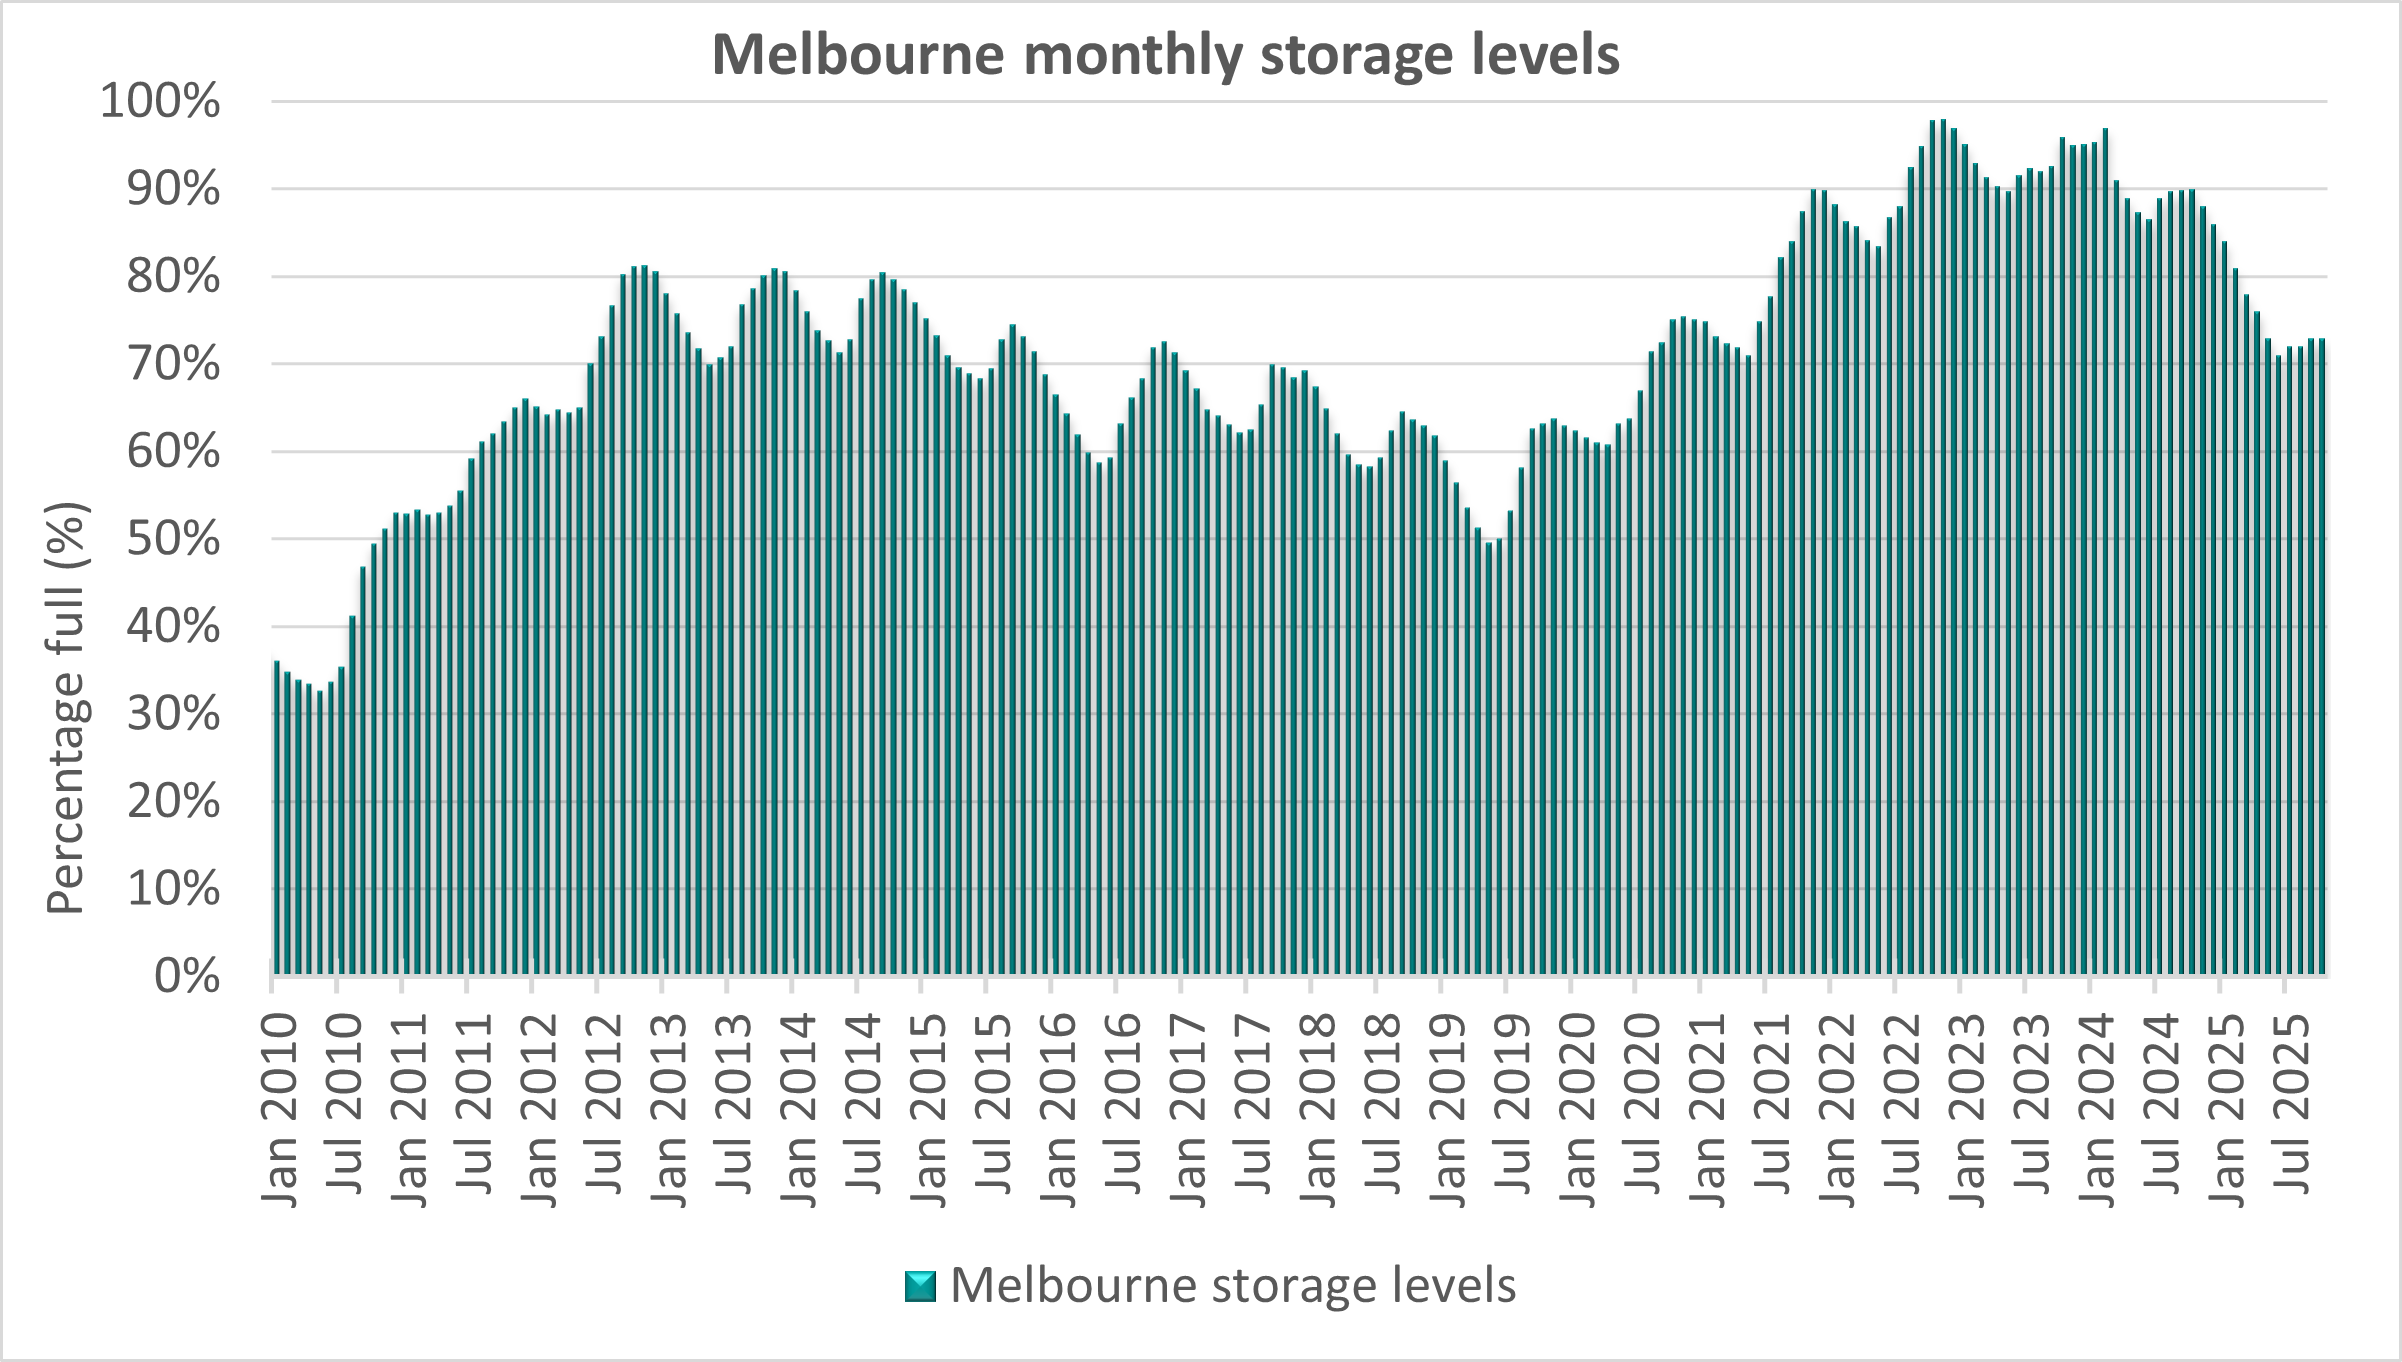
Melbourne monthly storage levels - end January 2010 to end October 2025
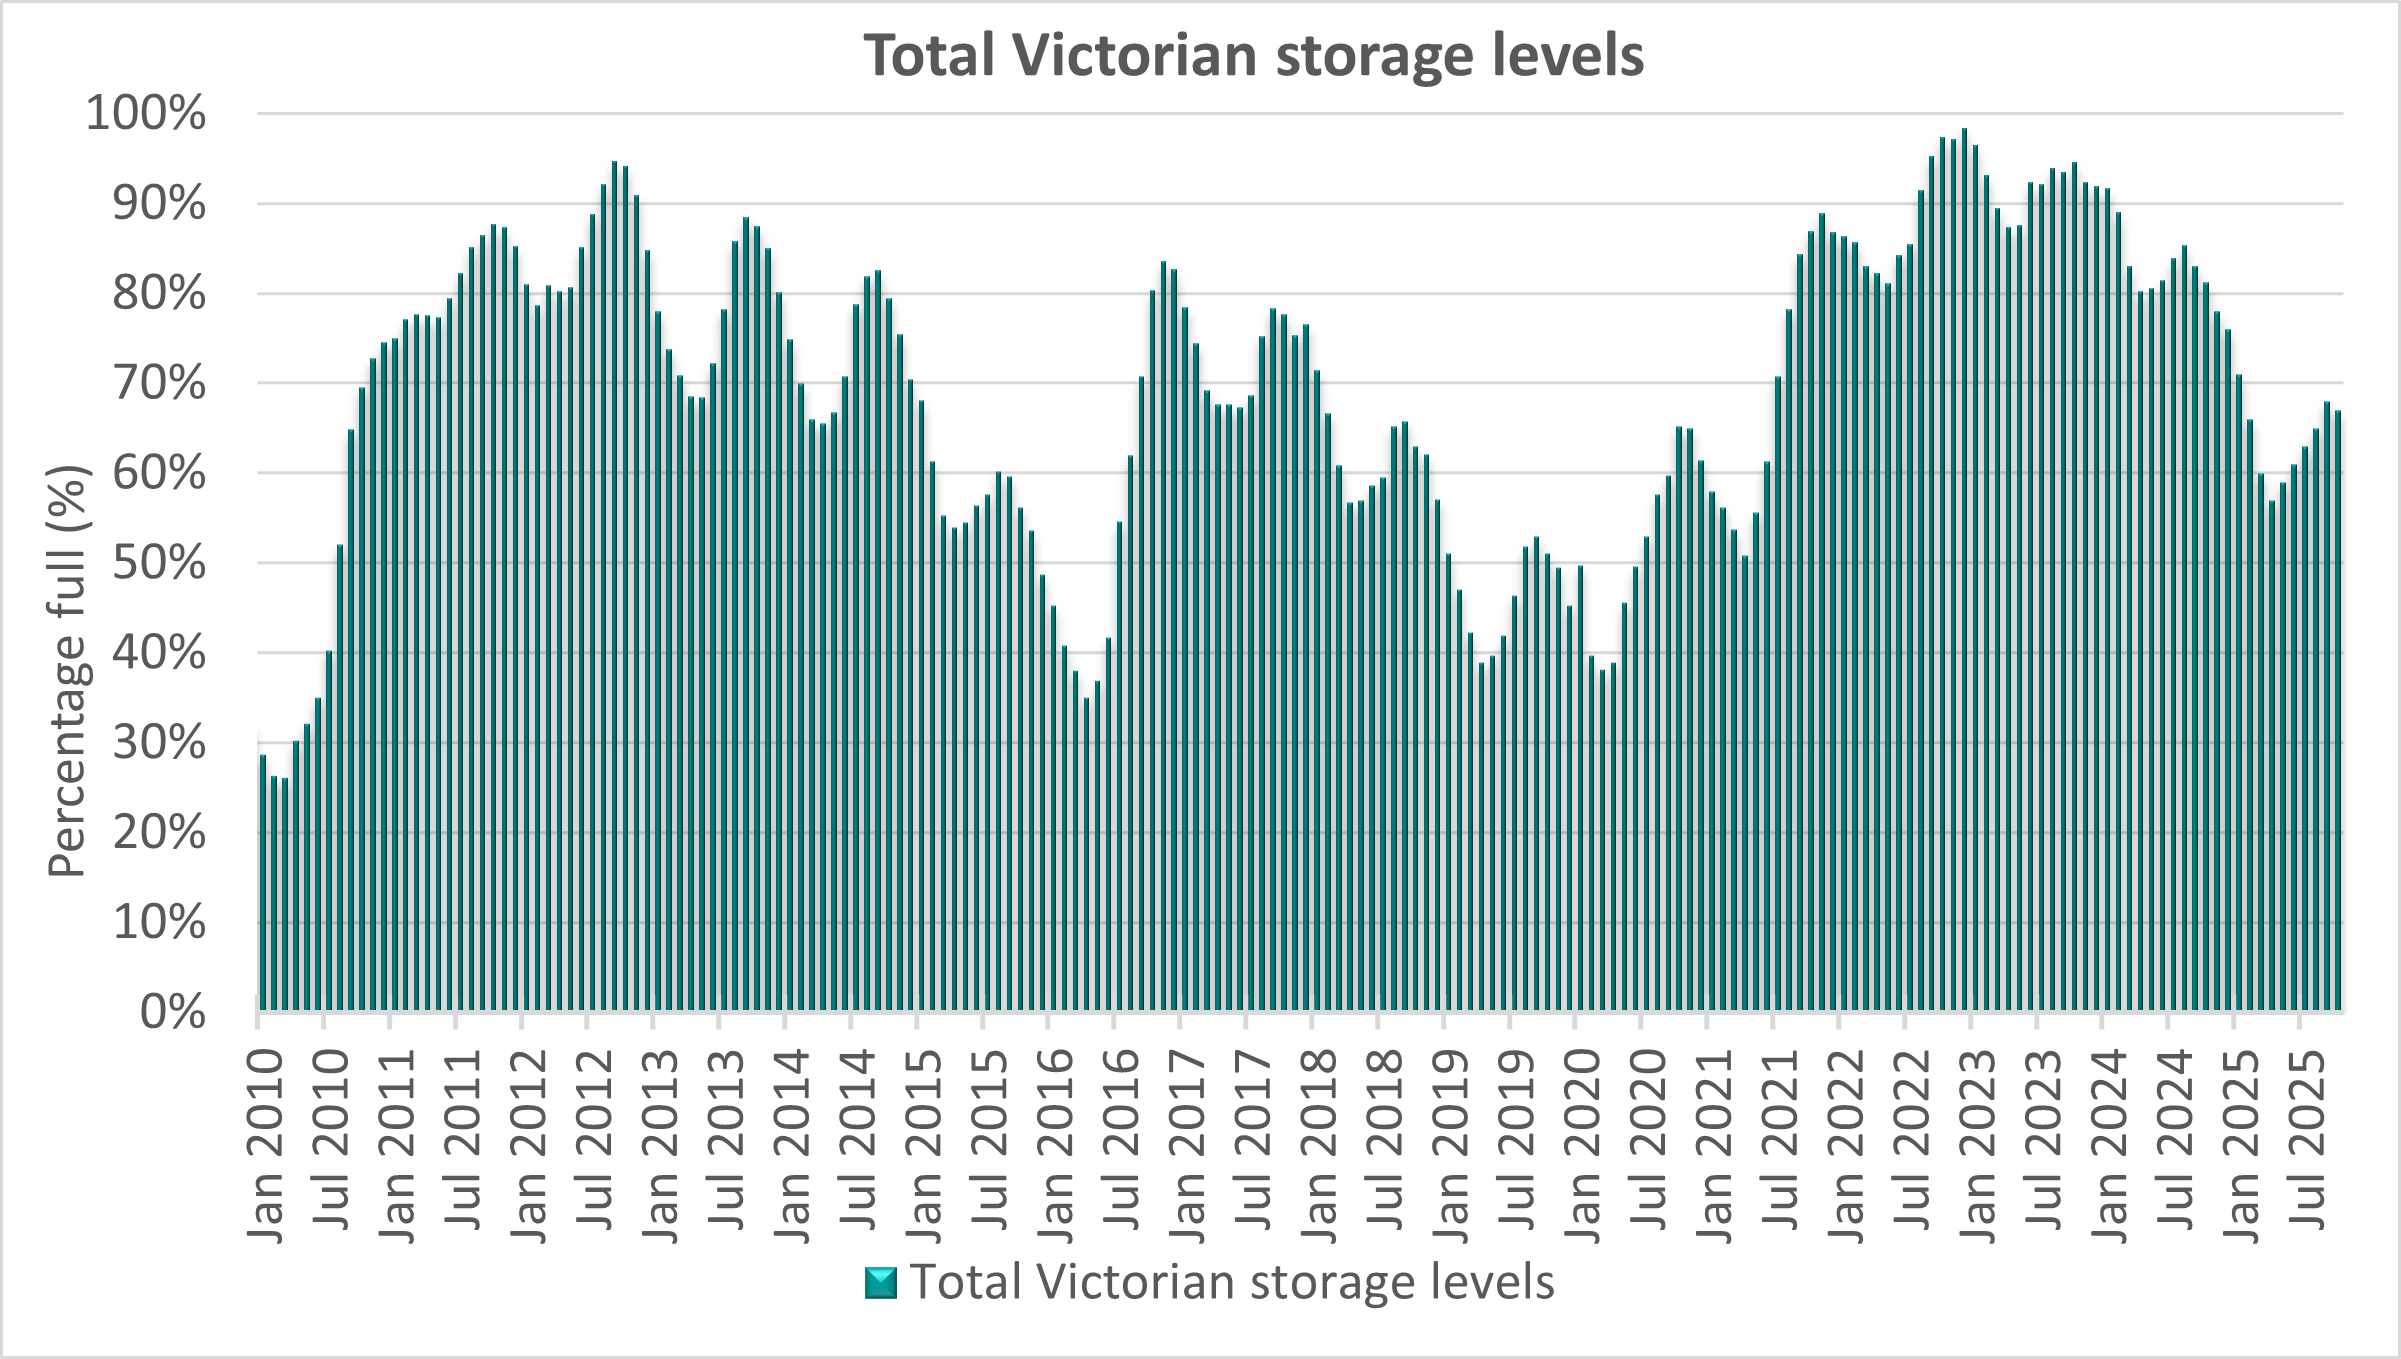
Total Victorian monthly storage levels - end January 2010 to end October 2025
Bureau of Meteorology rainfall maps
On the Bureau of Meteorology websites, view

- Map of rainfall received in the week ending 25 November 2025

- Map of total rainfall received 1 to 25 November 2025
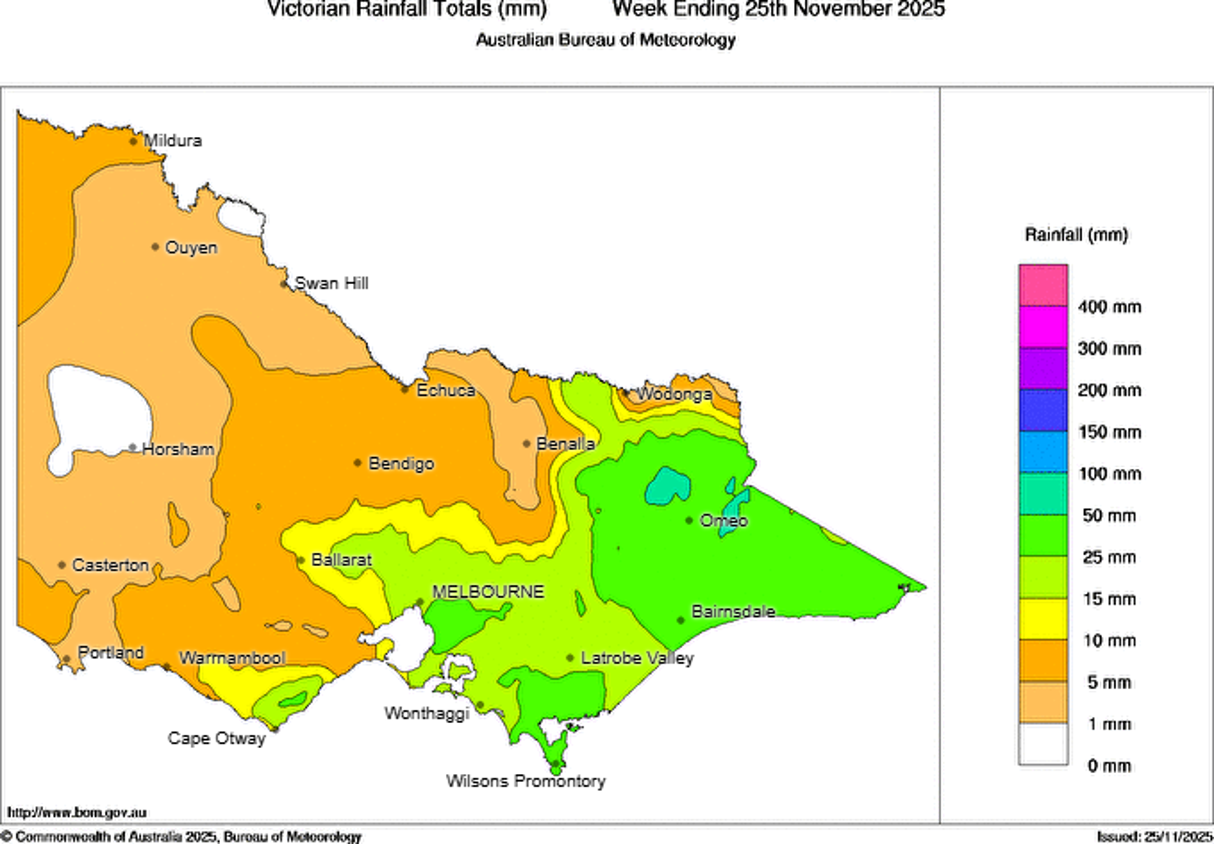
Map of rainfall received in the week ending 25 November 2025
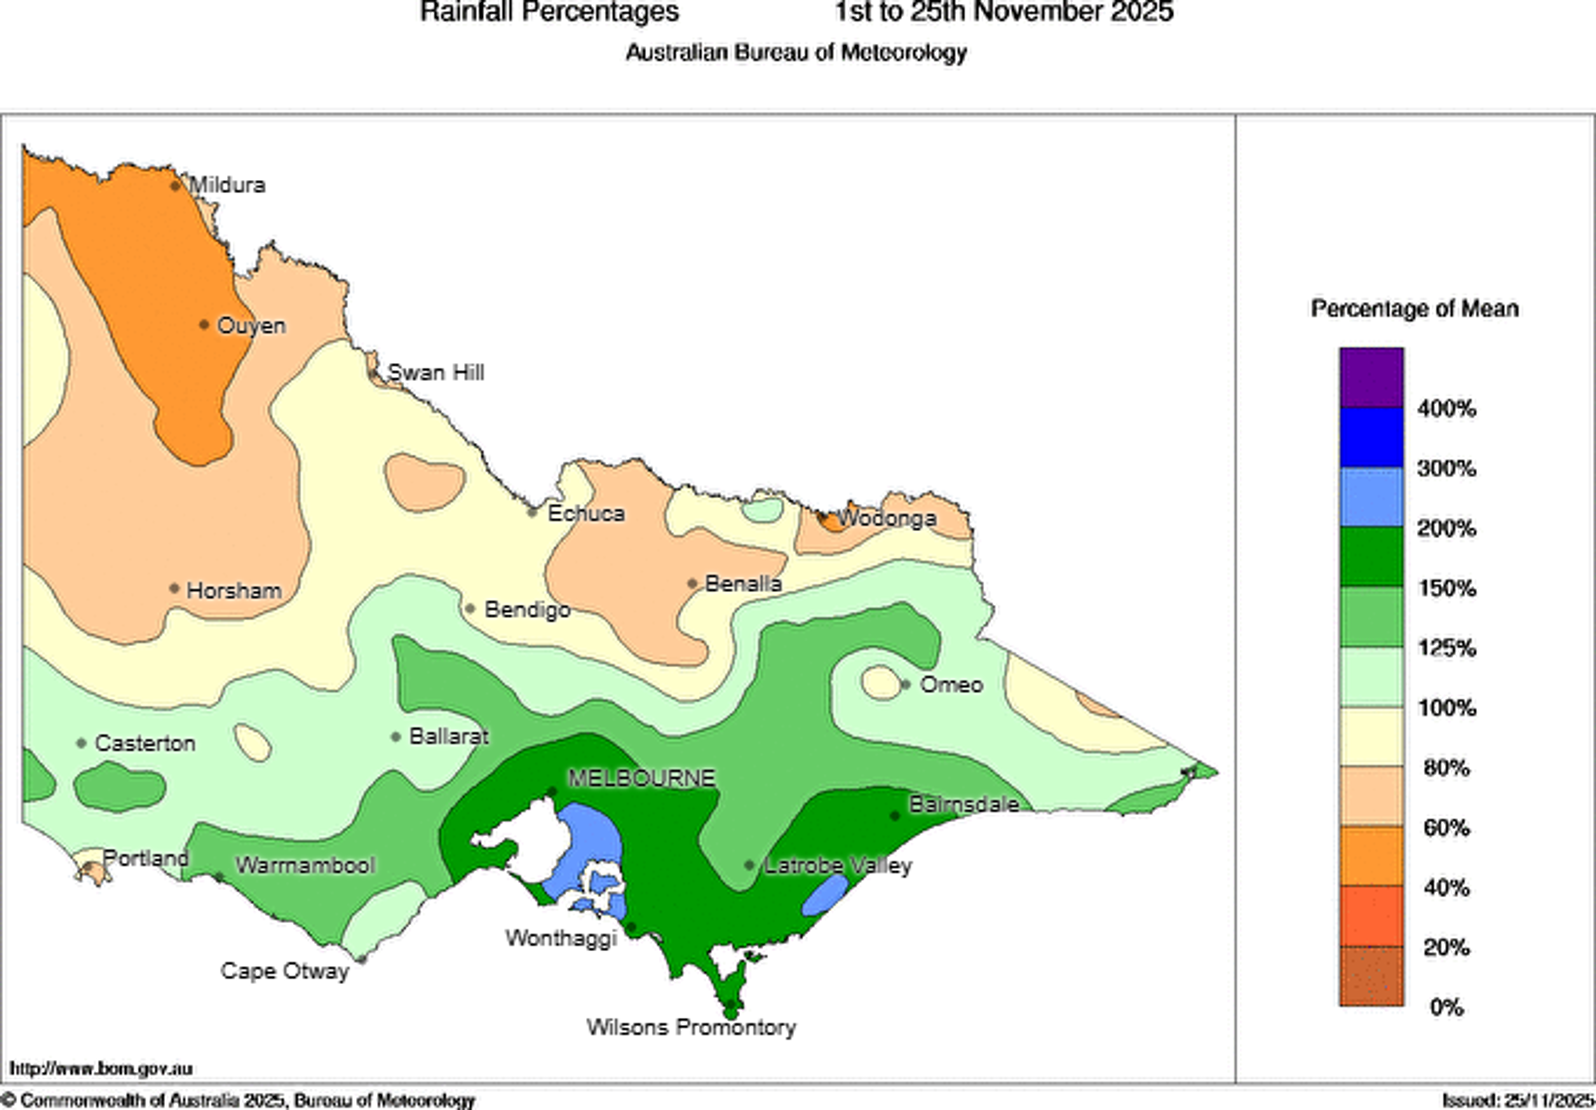
Map of total rainfall received 1 to 25 November 2025
Seasonal climate outlook
Bureau of Meteorology climate outlook
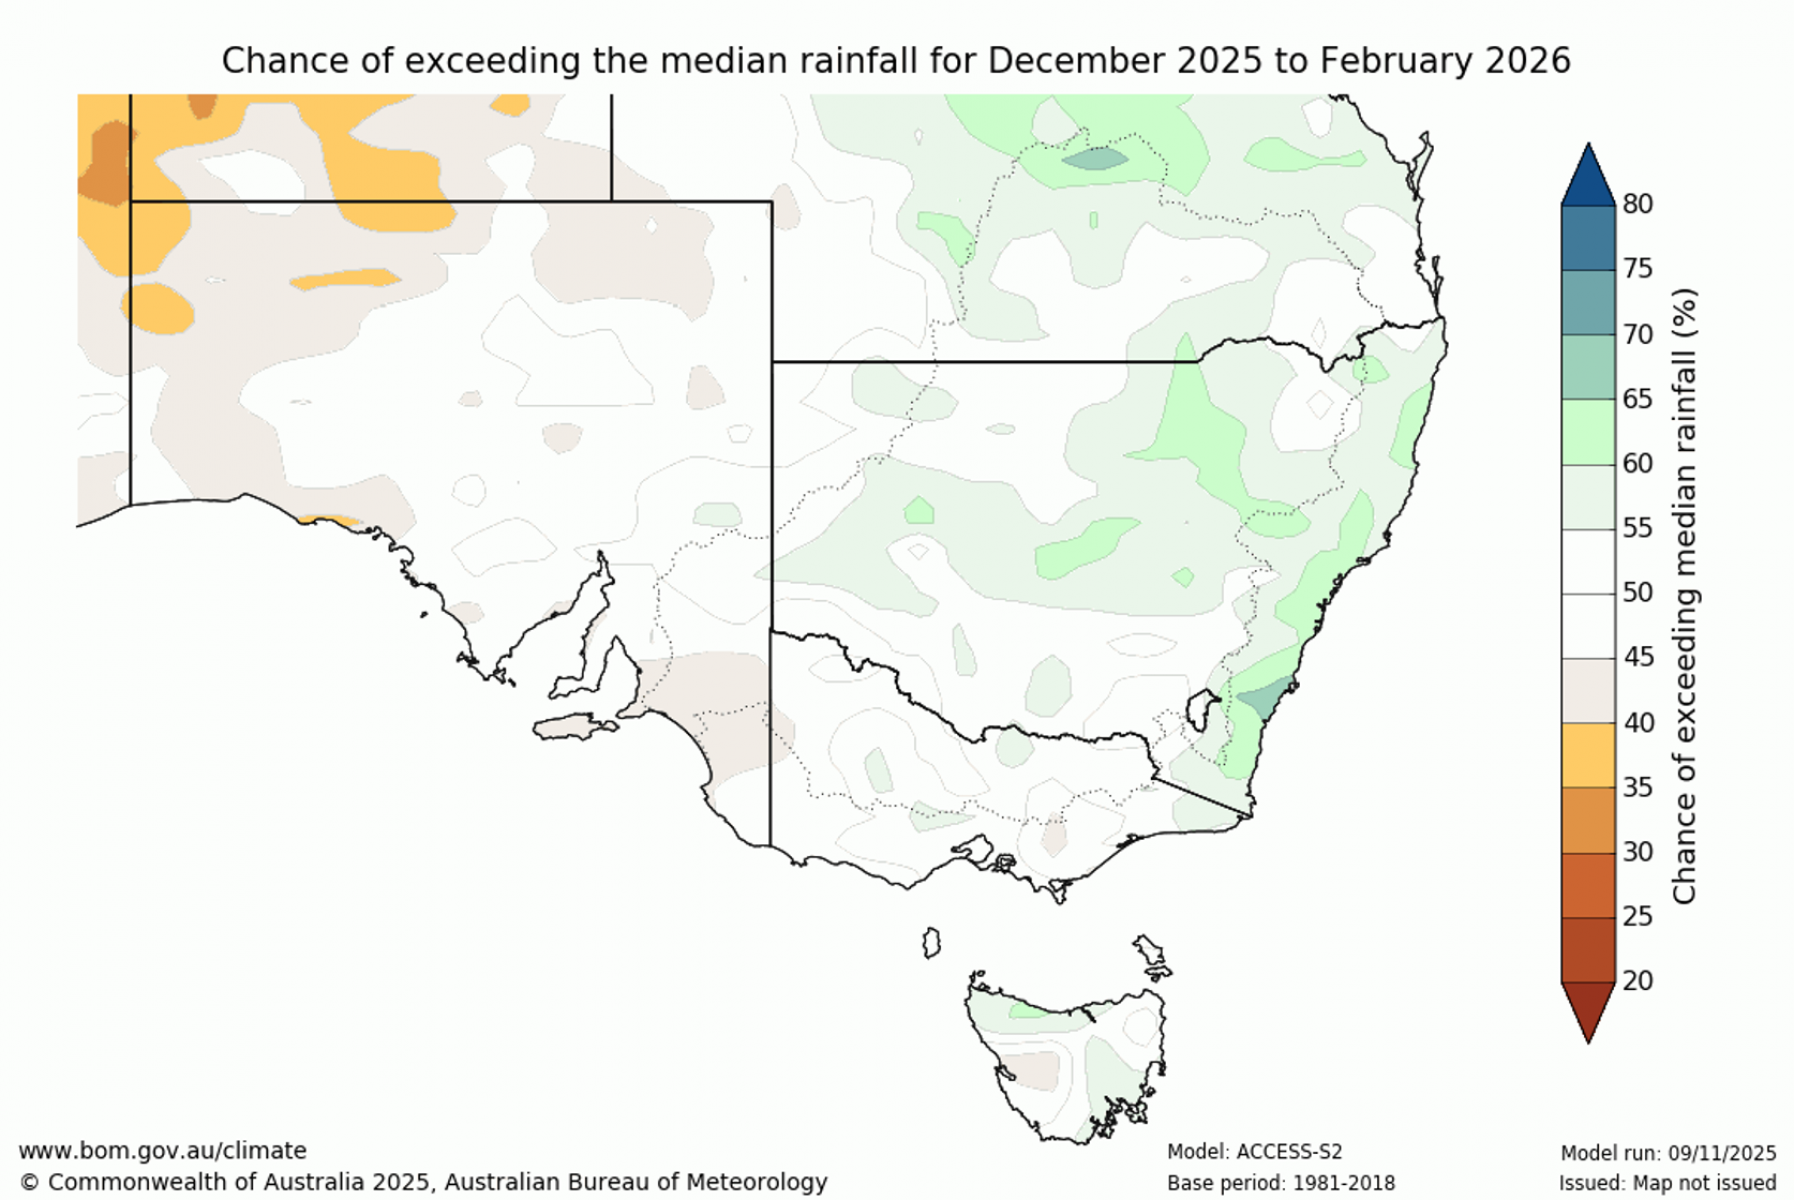
- The Bureau of Meteorology’s outlook shows that December 2025 to February 2026 rainfall continues to have an average likelihood of exceeding the median (40-60% chance) across the entire state.
- There is an increased chance of unusually high maximum temperatures for much of Victoria over the next three months.
- There is a high likelihood (>70% chance) of exceeding the median maximum temperature for December to February across most of Victoria. The likelihood rises to >80% for some parts of the southwest and Alpine regions, and decreases to 50-70% across part of East Gippsland.
- Updated on 27 November 2025. The next update is expected on 4 December 2025.
Climate driver update
Bureau of Meteorology climate driver update
- El Niño–Southern Oscillation (ENSO) remains neutral but there are signs that La Niña may be developing. The latest relative Niño3.4 SST index value for the week ending 9 November 2025 is −0.84 °C. Sustained values below –0.8 °C are consistent with a La Niña pattern. Weekly values of the relative Niño 3.4 index have been fluctuating around the La Niña threshold since mid-to-late September.
- The negative Indian Ocean Dipole (IOD) event remains active, with the latest index value rising to −1.57 °C for the week ending 9 November. A negative IOD typically results in above average spring rainfall over eastern Australia.
- The Southern Annular Mode (SAM) index is neutral as at 8 November. It is forecast to remain neutral over the next fortnight though there is a broad range in possible outcomes indicating increased uncertainty.
- Since July 2024, sea surface temperatures (SSTs) in the Australian region have been the warmest or second warmest on record for each respective month. Similarly, global SSTs remain substantially above average, with September 2025 the third warmest on record. Forecasts for December to February indicate SSTs to the south-east of Australia will continue to be warmer than average.
- Updated on 11 November 2025. The next update is expected on 4 December 2025.
Current urban restrictions
Central Highlands Water implemented Stage 1 restrictions on the Forest Hill System, which supplies groundwater to the Allendale, Broomfield, Kingston, Newlyn, Newlyn North, Smeaton and Springmount townships, from Wednesday 5 November due to continued dry conditions.
There are no water restrictions in place for any of Victoria’s other urban water supply systems, and they are subject to Permanent Water Saving Rules.
More information on urban water corporation restrictions is published on their websites.
Find your urban water corporation.
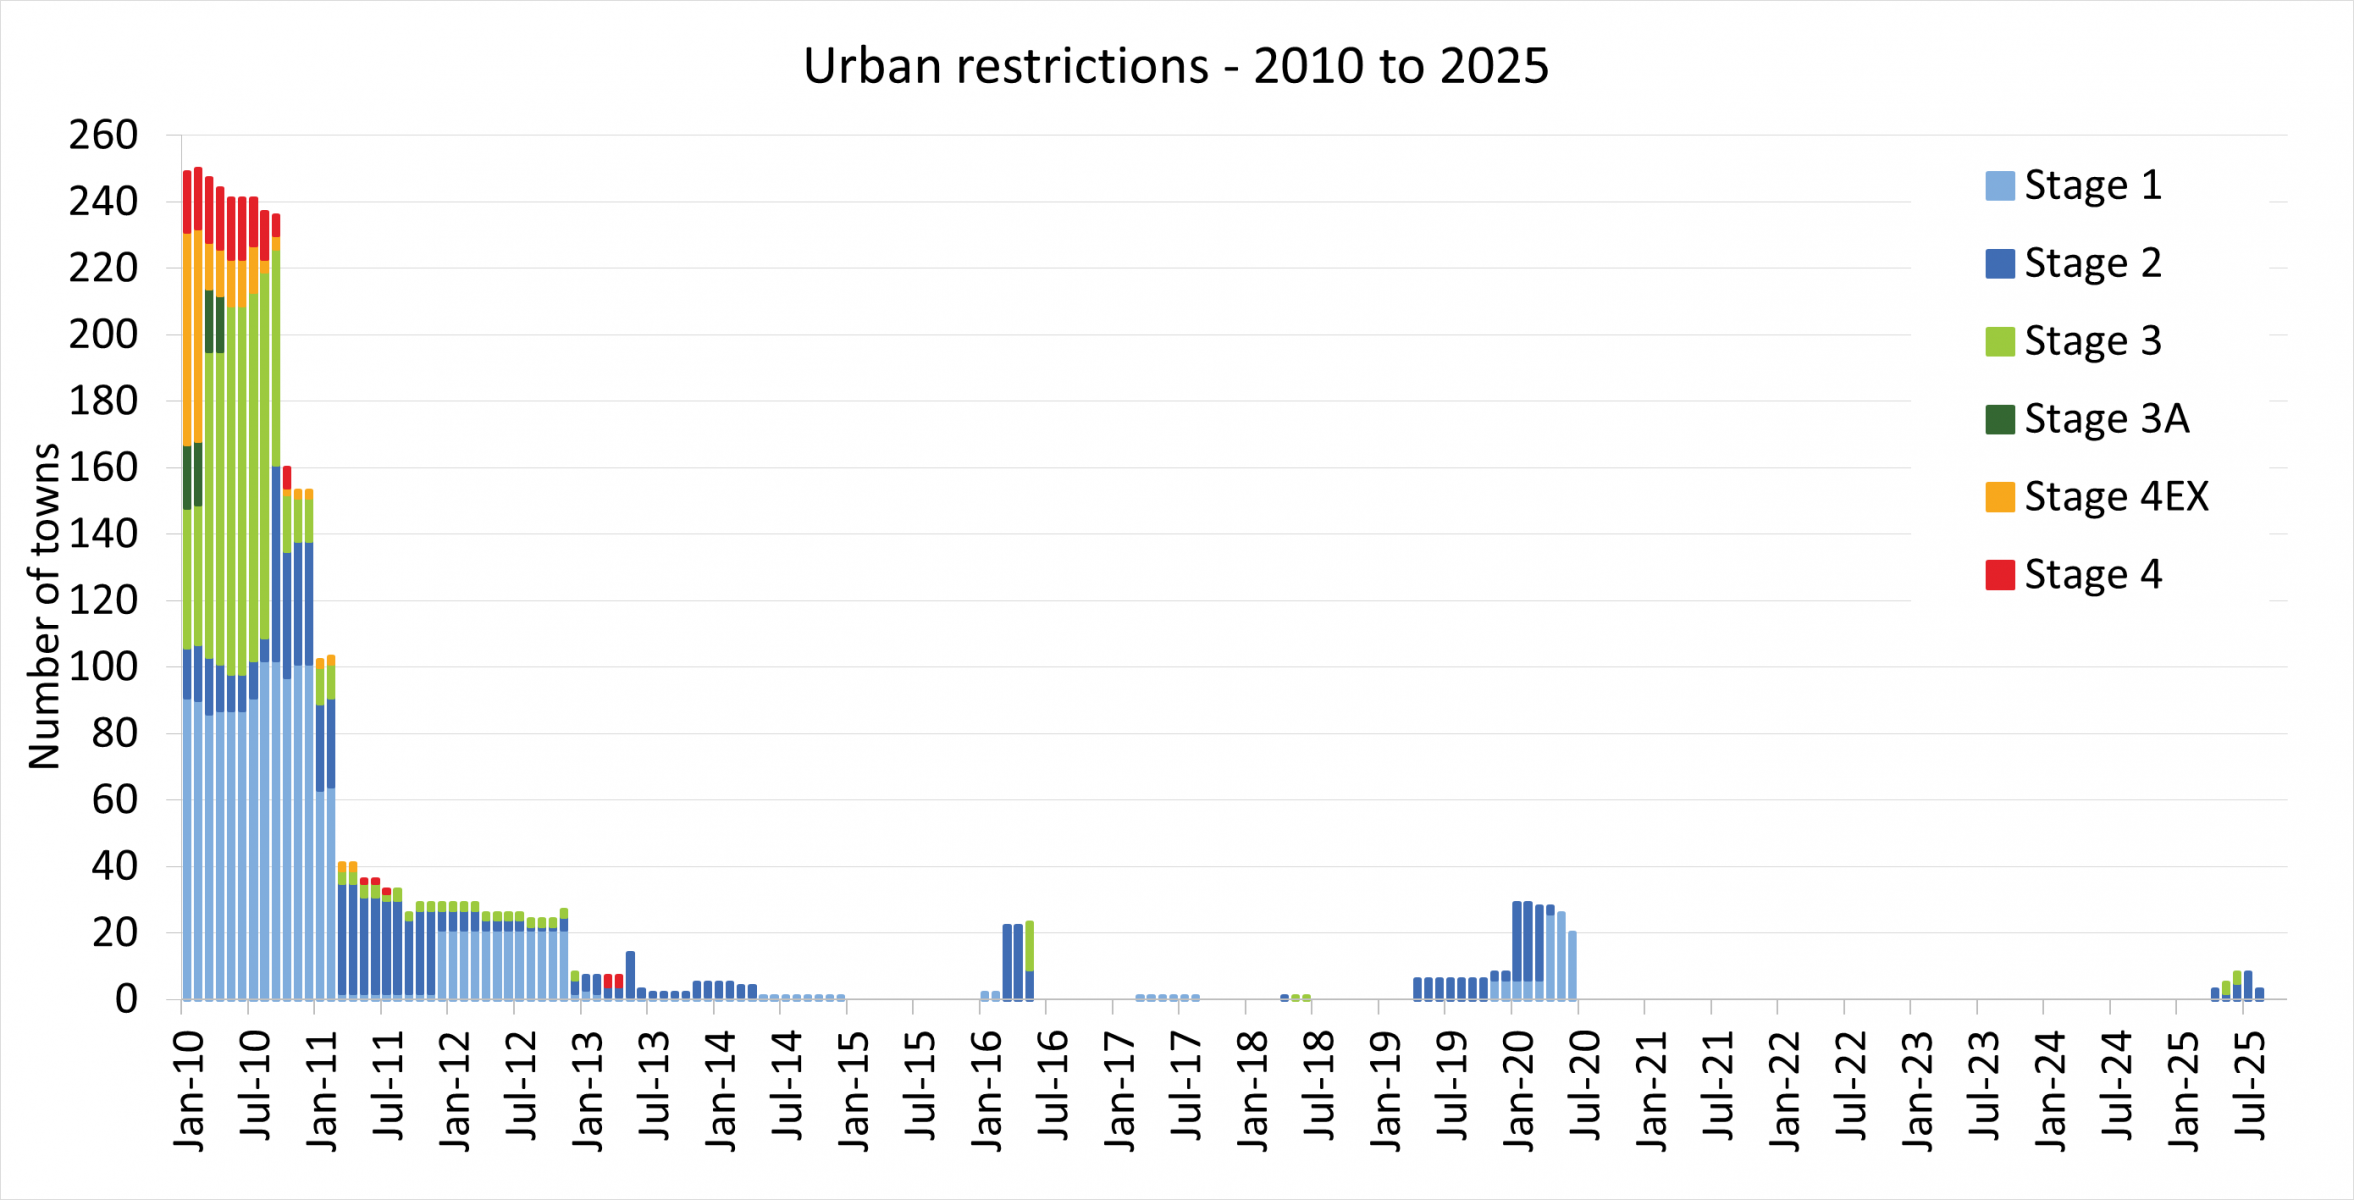
Monthly urban restrictions - 2010 to 2025
The graph and data below are updated at the end of each month.
Updated 5 November 2025. The next update is in early December 2025.
Graph of total number of towns on urban restrictions from January 2010 to October 2025
Stream restrictions
End-of-month stream restrictions - 2010 to 2025
As at 20 November 2025, there were 32 stream sections with restrictions or bans on licensed diversions across Victoria - 6 fewer than at the end of October 2025*. These are shown in red and purple in the map below.
Map of streams restricted as at 20 November 2025**
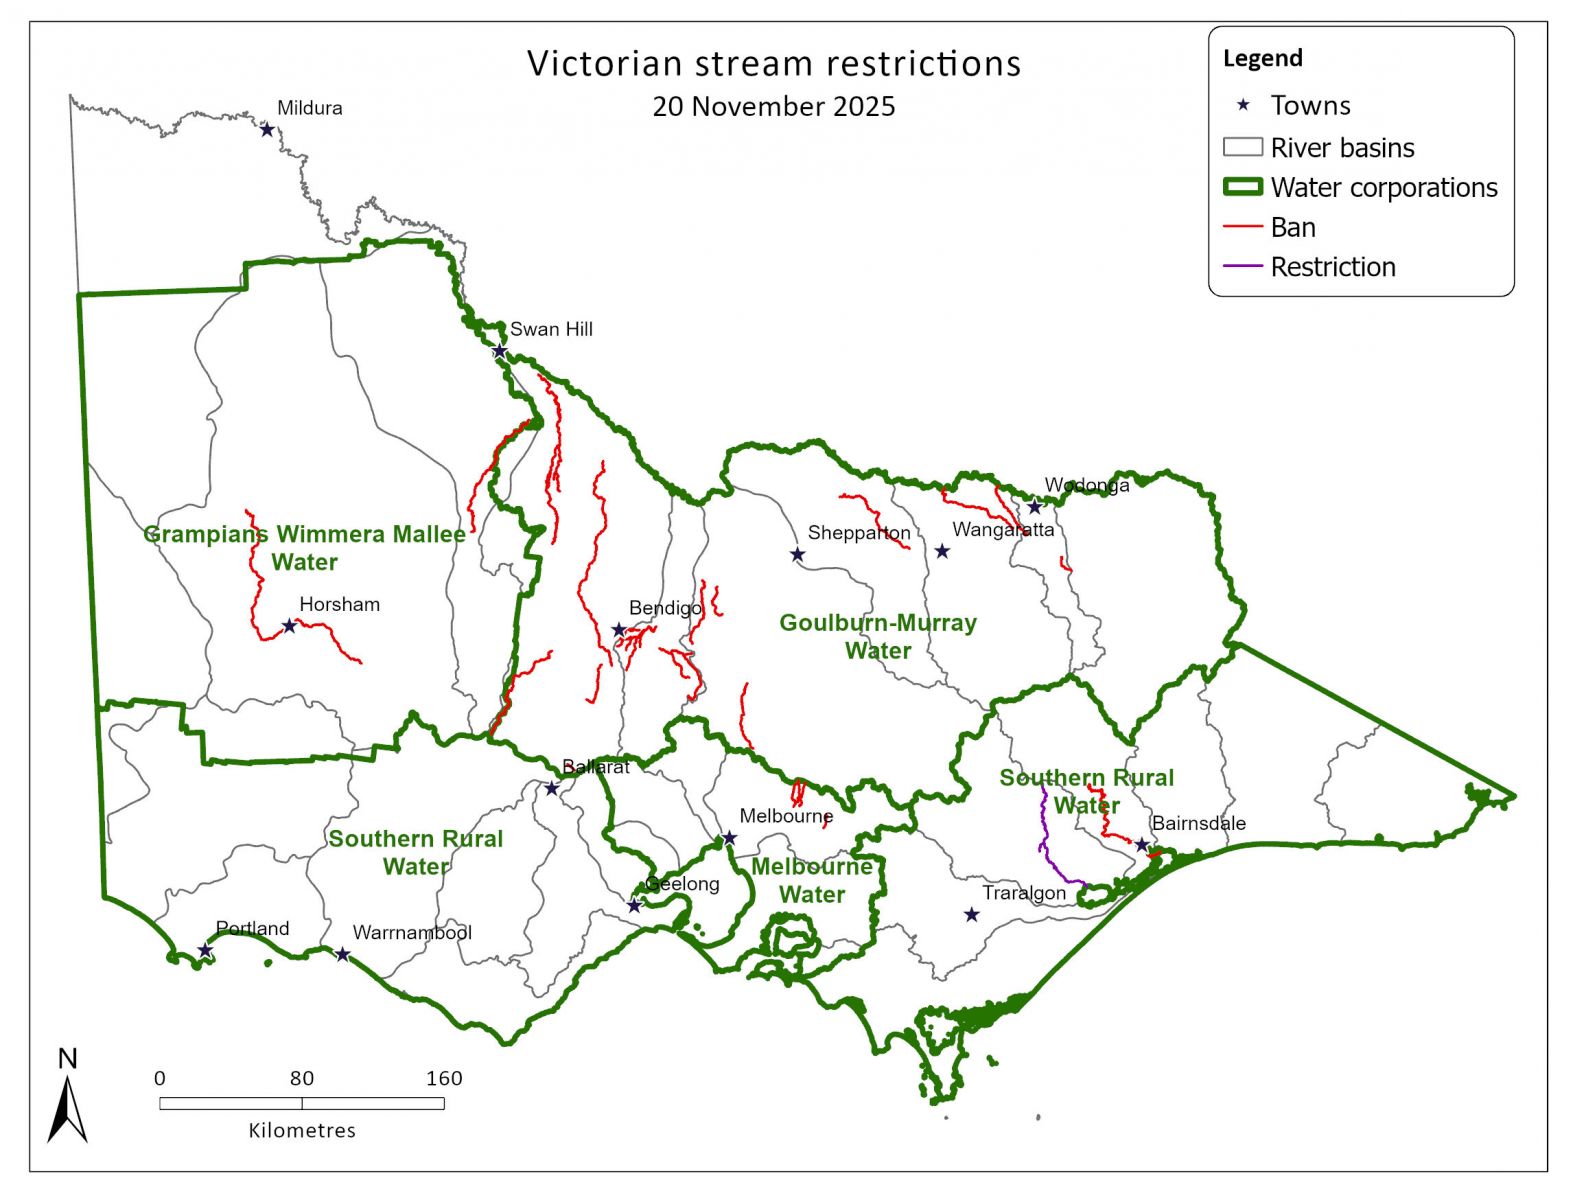
* This count includes management sections subject to diversion restrictions (the term used for partial limitation on take) as well as complete bans on take.
** This map is for indicative purposes only and licence holders should refer to their respective water corporation regarding stream restrictions. This map does not display all stream restrictions.
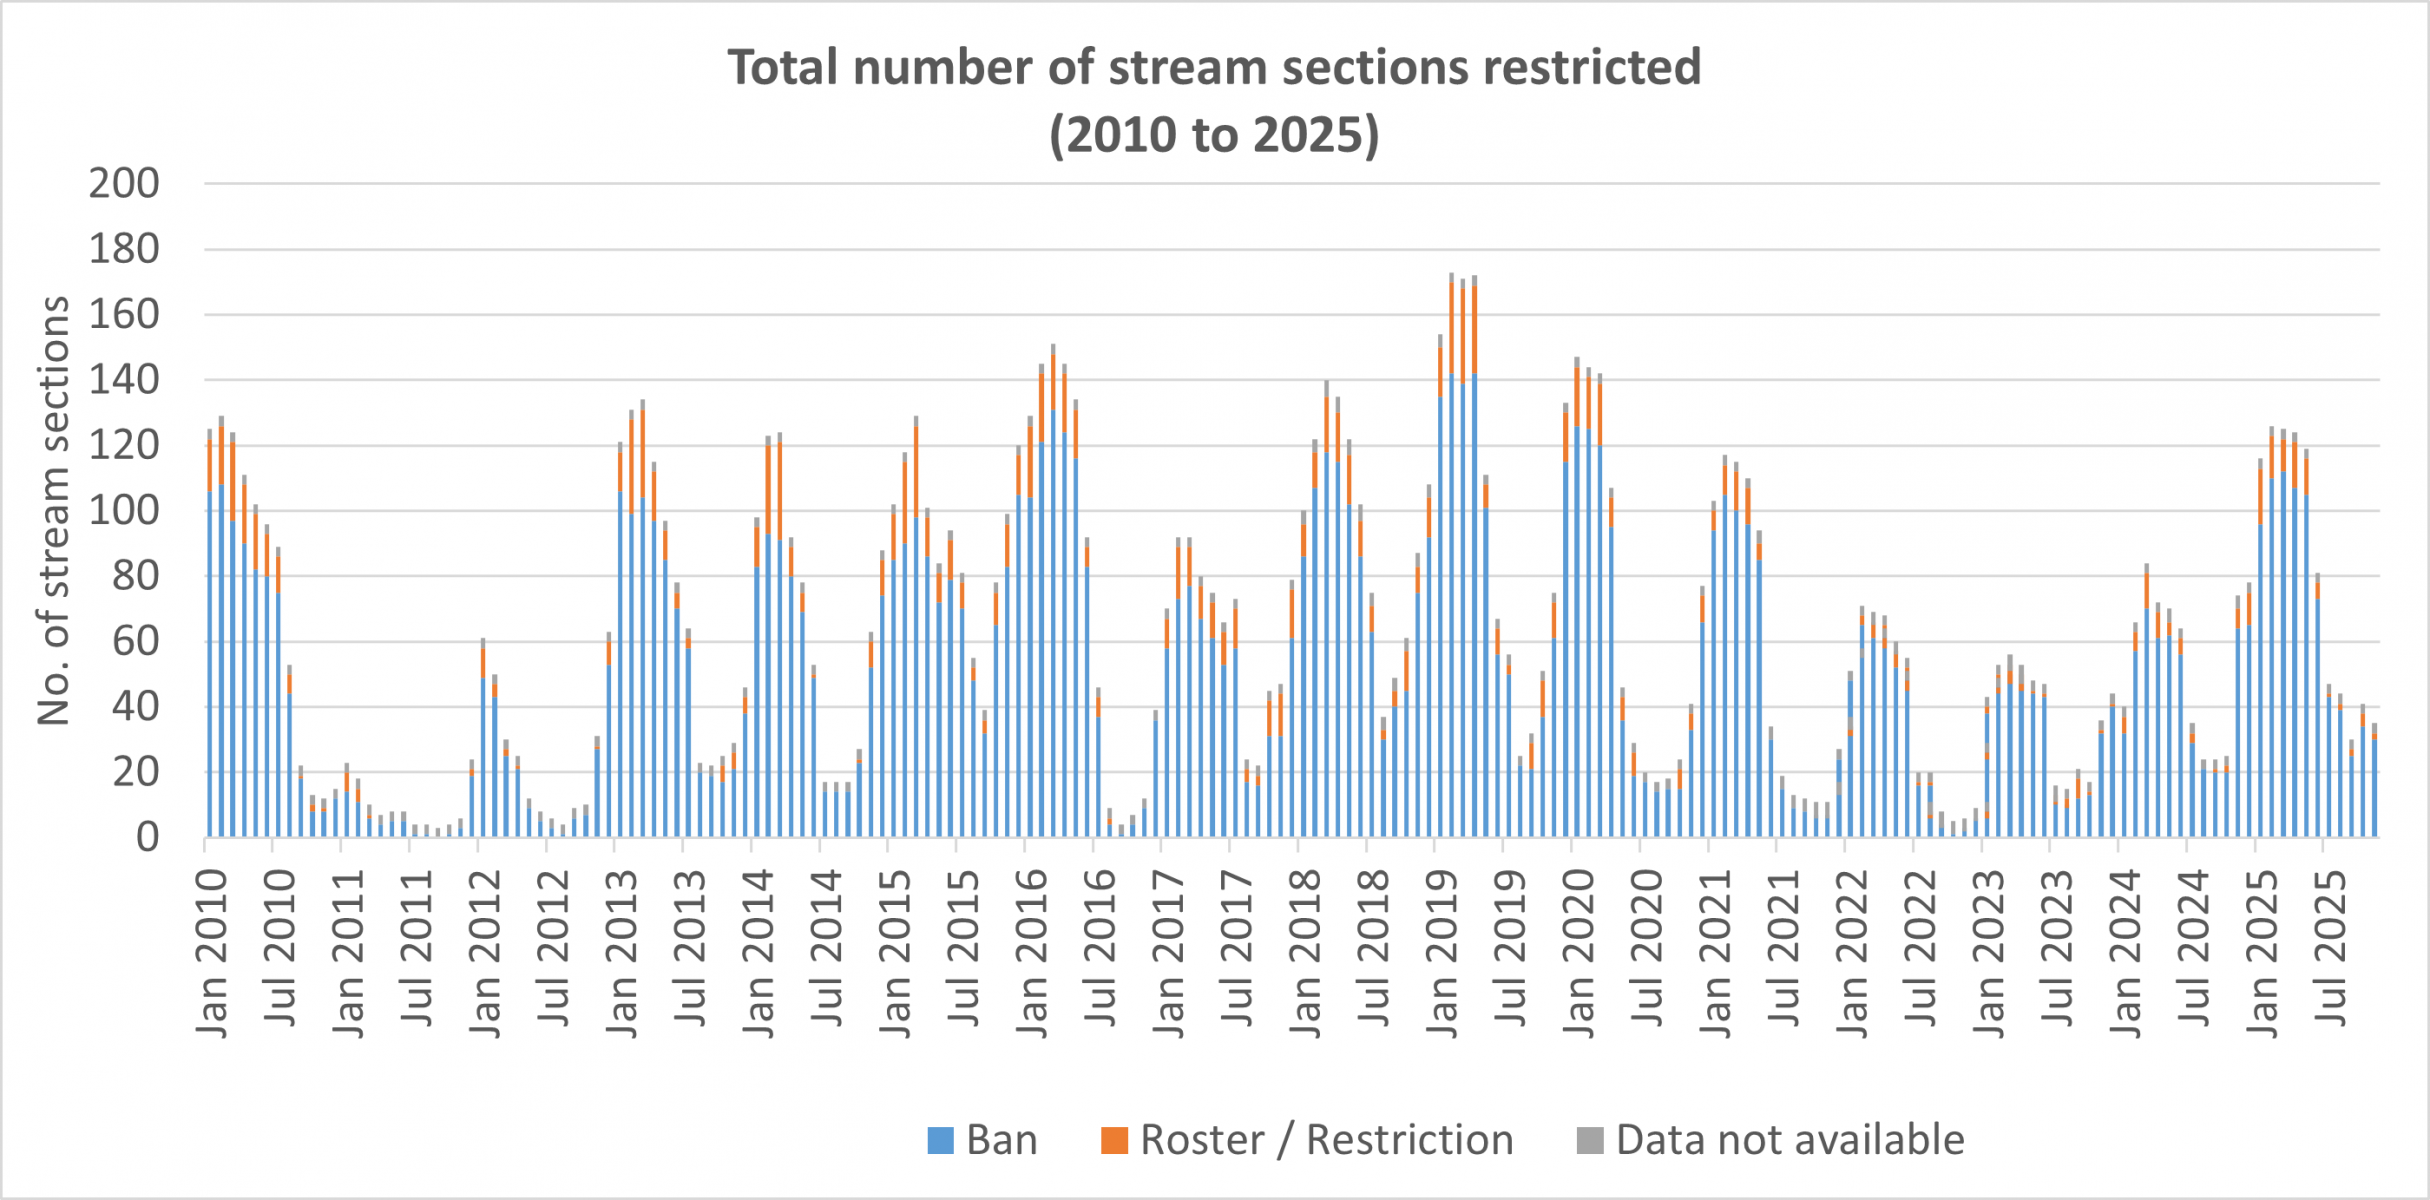
The graph and data below are as at the end of each month.
Updated 20 November 2025. The next update is early January 2026.
Graph of total number of stream sections restricted from January 2010 to November 2025
Groundwater summary
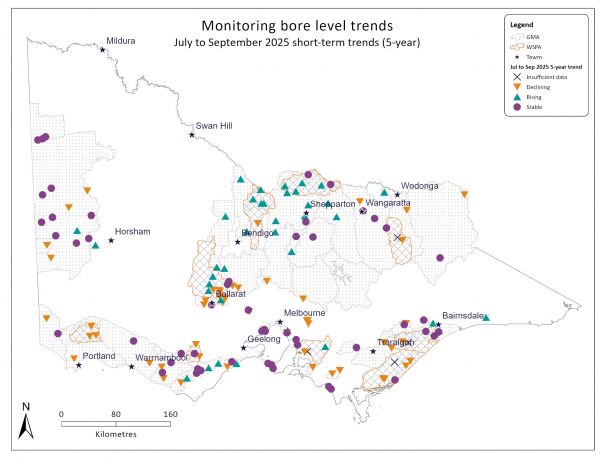
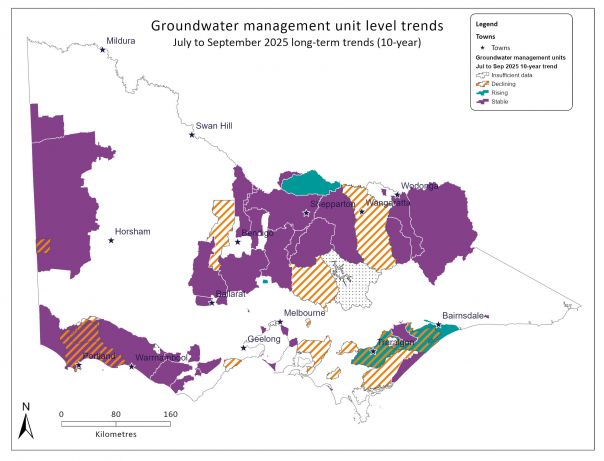
Quarterly groundwater level trend update
1 July to 30 September 2025 quarter.
Groundwater level trends in groundwater management units (GMUs) are reported quarterly. Groundwater level trends for GMUs have been determined based on 5 years (short-term) or 10 years (long-term) of consistent monitoring data from key bores in the State Observation Bore Network (SOBN).
There are 2 categories of GMUs:
- Groundwater management areas (GMAs).
- Water supply protection areas (WSPAs).
Updated 27 November 2025. The next update is in early 2026 (for the October to December 2025 quarter).
Notes
- Trends are calculated mathematically using data with variable timescales, and do not necessarily represent the status of the resource for management purposes.
- There was insufficient data or monitoring bores available to determine a short-term and long-term trend in 4 GMAs.
Short and long term groundwater level trend maps
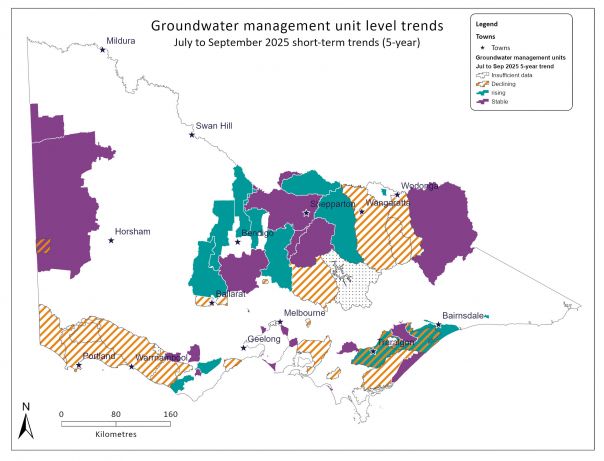
- Groundwater management unit short-term trends - July to September 2025 quarter
- State Observation Bore Network key bore short-term trends - July to September 2025 quarter
- Groundwater management unit long-term trends - July to September 2025 quarter

- State Observation Bore Network key bore long-term trends - July to September 2025 quarter

Groundwater management unit short-term trends - July to September 2025 quarter
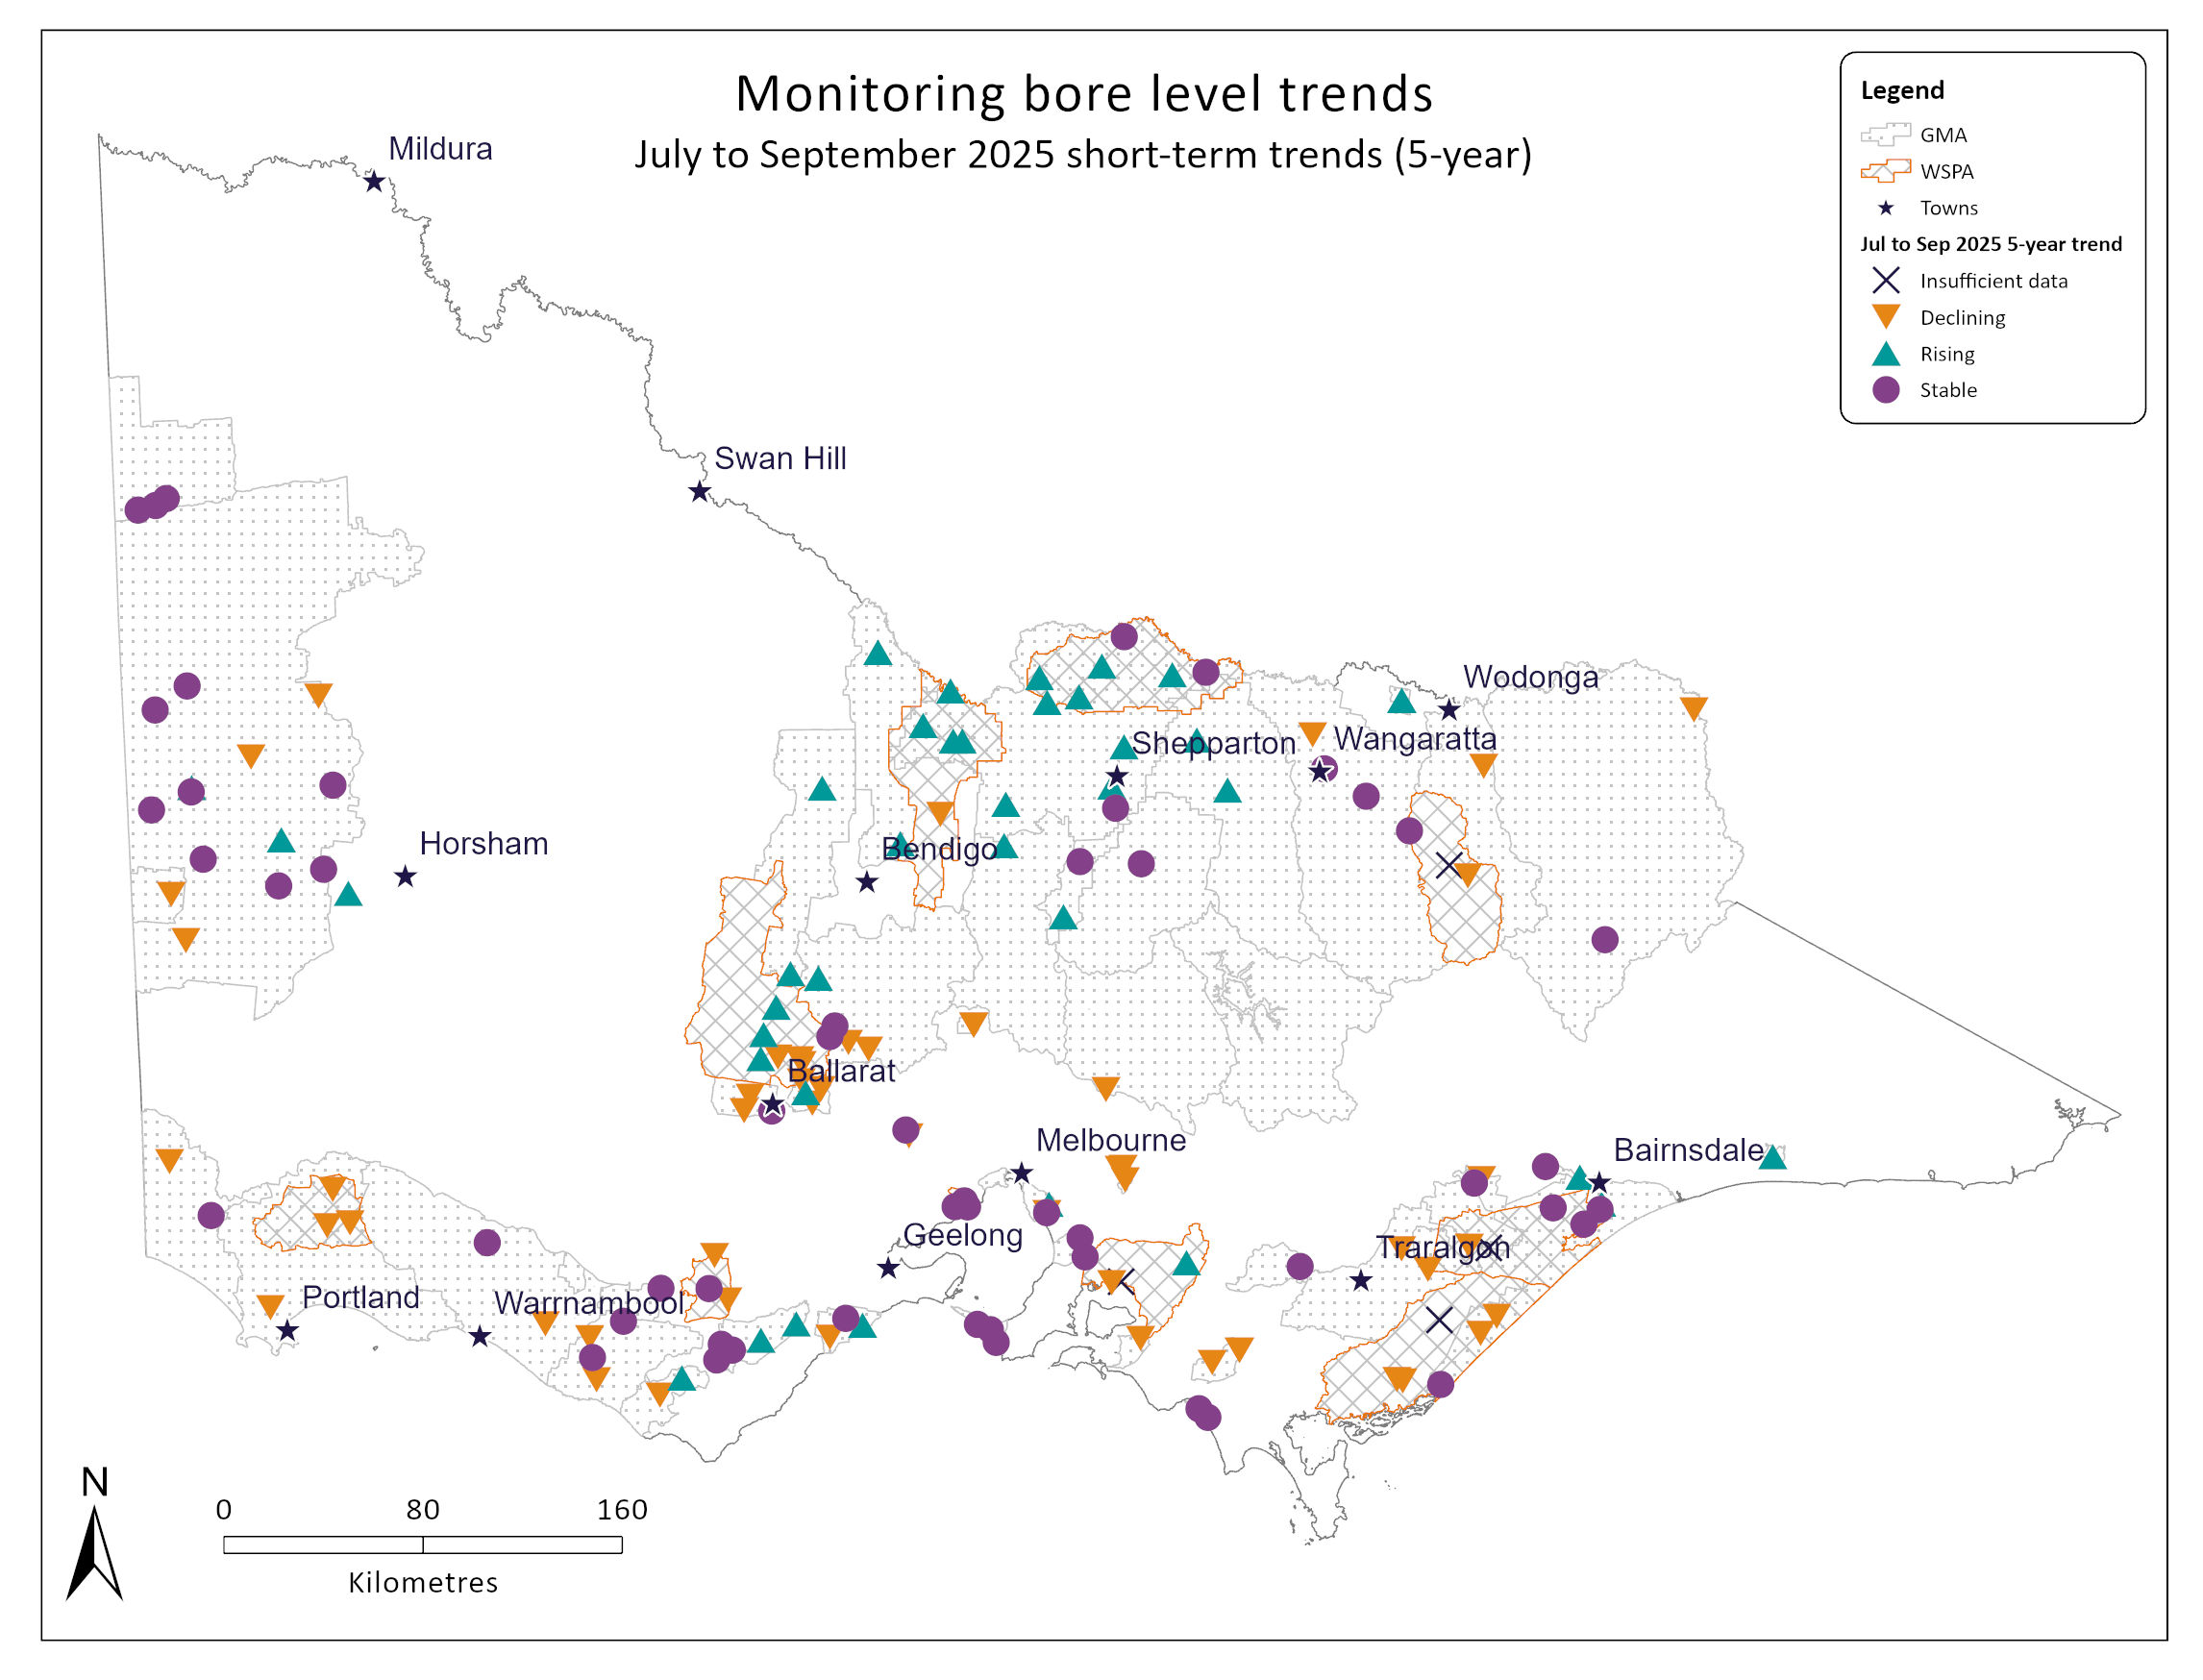
State Observation Bore Network key bore short-term trends - July to September 2025 quarter

Groundwater management unit long-term trends - July to September 2025 quarter
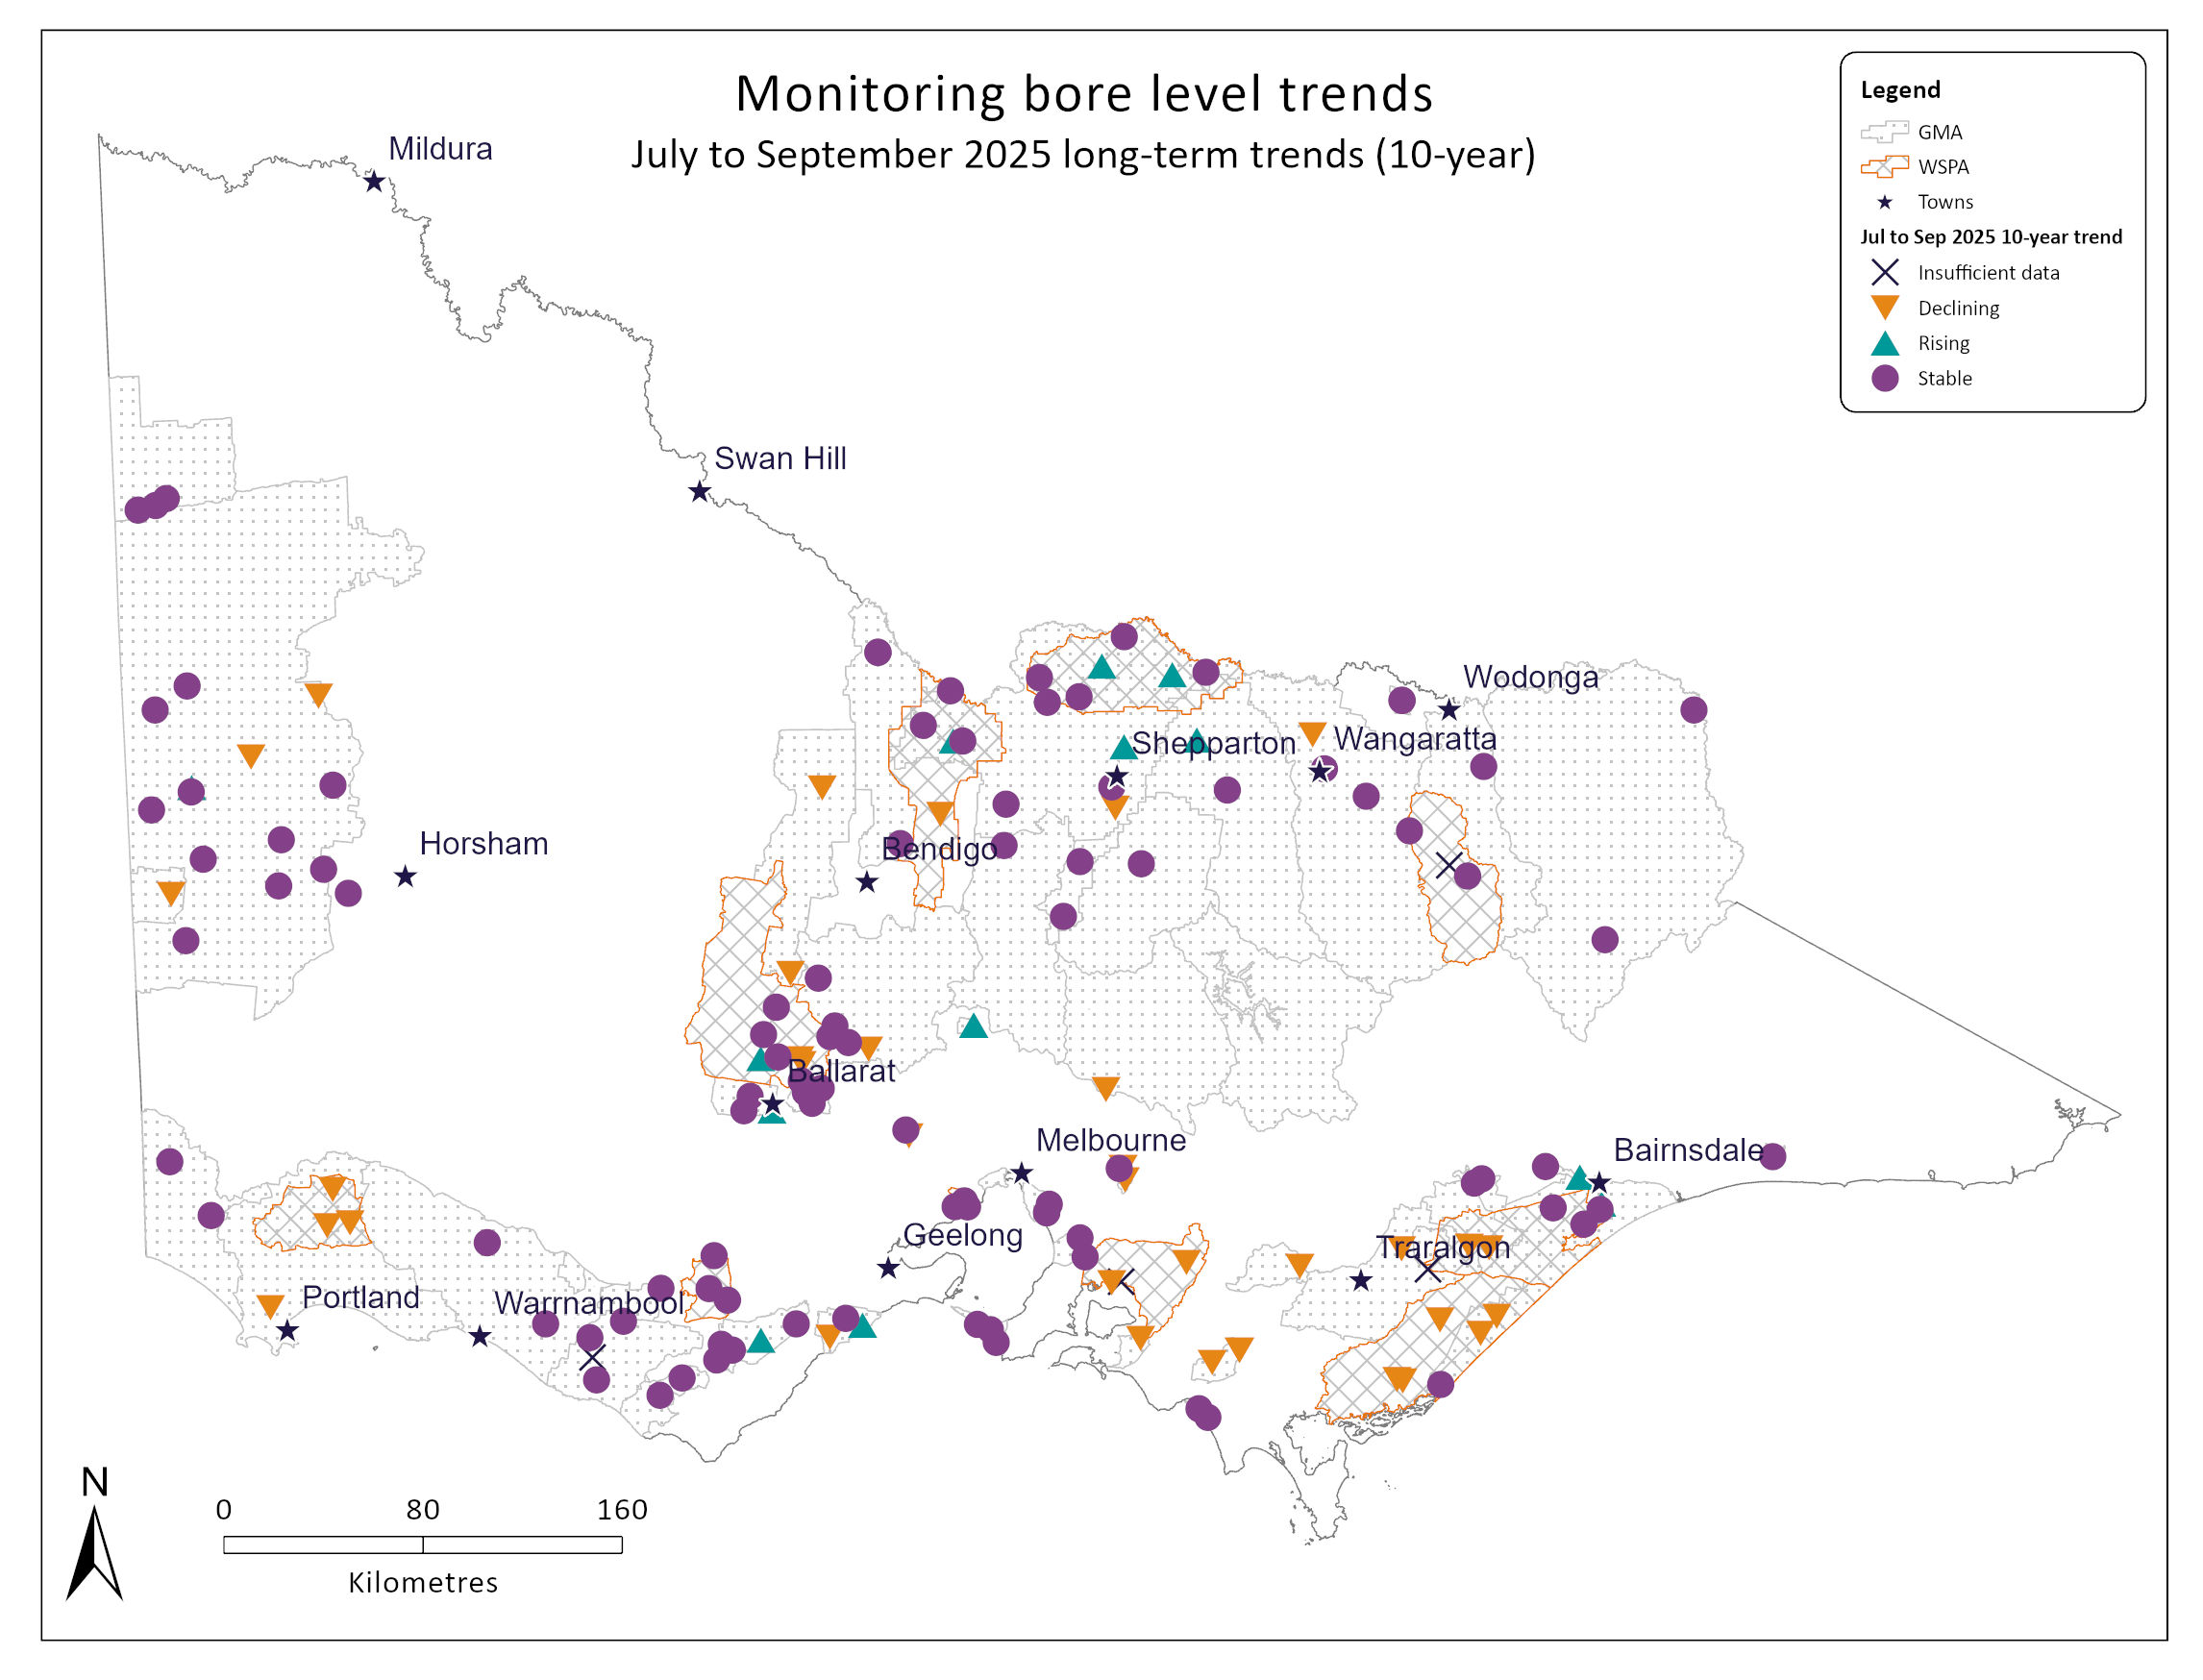
State Observation Bore Network key bore long-term trends - July to September 2025 quarter
Groundwater restrictions
In 2025-26, 4 GMUs are subject to allocation restrictions:
- Barnadown (Lower Campaspe Valley WSPA) at 75%.
- Blampied and Newlyn (Loddon Highlands WSPA) at 50%.
- Deutgam WSPA at 50%.
- Neuarpur subzone 1 (West Wimmera GMA) at 80%.
Updated 1 October 2025.
Seasonal determinations and allocations
Seasonal determinations are made against water shares to provide allocations in declared systems. These can be for high reliability (HRWS) or low reliability (LRWS) water shares. In northern Victoria, Goulburn-Murray Water makes the seasonal determinations in the relevant systems, while Southern Rural Water makes the seasonal determinations in the Thomson/Macalister and Bacchus Marsh/Werribee systems.
In the Grampians Wimmera Mallee Water area, resource assessments are undertaken every month to determine the amount of water that can be made available to entitlement holders. These monthly assessments result in a formal announcement on water allocations.
Coliban Water assesses seasonal allocations for customers on its rural network based on available resources in the Coliban System.
Goulburn-Murray Water
| System | Seasonal determinations HRWS | Seasonal determinations LRWS | Date updated |
|---|---|---|---|
| Murray | 100% | 0% | 17 November 2025 |
| Broken | 37% | 0% | 17 November 2025 |
| Goulburn | 62% | 0% | 17 November 2025 |
| Campaspe | 100% | 0% | 1 July 2025 |
| Loddon | 62% | 0% | 17 November 2025 |
| Bullarook | 0% | 0% | 1 July 2025 |
Southern Rural Water
| System | Seasonal determinations HRWS | Seasonal determinations LRWS | Date updated |
|---|---|---|---|
Bacchus Marsh / Werribee | 70% | 0% | 18 November 2025 |
| Thomson / Macalister | 100% | 0% | 2 September 2025 |
Grampians Wimmera Mallee Water
| System | Seasonal determinations | Date updated |
|---|---|---|
| Wimmera-Mallee Pipeline Product | 19% | 7 November 2025 |
Coliban Water
| System | Seasonal determinations | Date updated |
|---|---|---|
| Coliban Rural System | 100% | 15 November 2025 |
Page last updated: 27/11/25